


Electrophysiological mapping strategies targeting atrial tachyarrhythmia, such as AF, have improved considerably over the past few years. However, designing effective ablation strategies for persistent AF remains a major challenge.1 Since the development of the pulmonary vein isolation procedure in the late 1990s, several additional ablation strategies have been proposed, including linear lesions, complex fractionated electrogram (EGM) ablation, low-voltage area (LVA) ablation, and identification and ablation of rotational activity and presumed trigger sites.2–5 Although these techniques showed promising results in single-centre studies, they did not lead to widespread improvement in procedural outcome in multicentre studies.6 This can only partly be due to the fact that there is still an inadequate understanding of the mechanisms and electropathological substrate underlying AF.
Arrhythmogenesis depends on the presence of a substrate and a trigger. AF initially starts in a paroxysmal form, which is mainly based on the presence of triggers.2 Progression of AF is accompanied by structural and electrical remodelling, which can typically be described as a progressive change in electrophysiological properties of the myocardium caused by cardiovascular comorbidities and AF itself.7 This results in complex electrical conduction disorders, which is defined as electropathology.8 With the progression of AF, there is an increase in electropathology. The severity of electropathology thus defines the stage of AF and is a major determinant of the effectiveness of AF therapy.
In an attempt to find the substrate underlying AF, the vast majority of studies directly focus on electrophysiological properties measured during AF or during atrial pacing. However, what the specific features of AF-related electropathology are, is at present unknown. These features may include conduction delay and block, signal morphology, such as potential voltages and fractionation, and electrical asynchrony between the endo- and epicardium, as illustrated in Figure 1. It is essential to first quantify electrophysiological properties of atrial tissue and then to examine the inter- and intra-individual variation in these quantified parameters during normal sinus rhythm (SR). Next, comparison of these parameters between patients with and without a history of AF reveals quantified electrophysiological features that are specific to AF patients. The most suitable objective parameter can then help identify patients at risk for early onset or progression of AF. This review summarises current knowledge on quantified features of atrial electrophysiological properties during SR and explores its relevance in identifying AF-related electropathology.
Excitation of the Atria
It is common knowledge that during SR, electrical activity originates from the sino-atrial node (SAN) area, from where the activation first spreads over the right atrium (RA) and towards the left atrium (LA) via Bachmann’s bundle (BB), coronary sinus (CS) musculature or interatrial septum. BB is considered to be the preferential route of interatrial conduction as it is a highly organised bundle of muscular fibres arranged in parallel fashion and it is by far the largest of the anatomical interatrial connections.9 Detailed analysis of SR activation was first performed by Boineau et al., who performed epicardial mapping in dogs.10 Later, Cox et al. were the first to create an epicardial isochronal map of one SR beat activating both the right and left atrium in a human.11 Since the 1990s, the advent of electroanatomical mapping systems allowed detailed measurement of impulse propagation inside the human atria. Knowledge of atrial excitation patterns during SR and its variations enabled detection of propagation abnormalities associated with arrhythmia, such as AF.
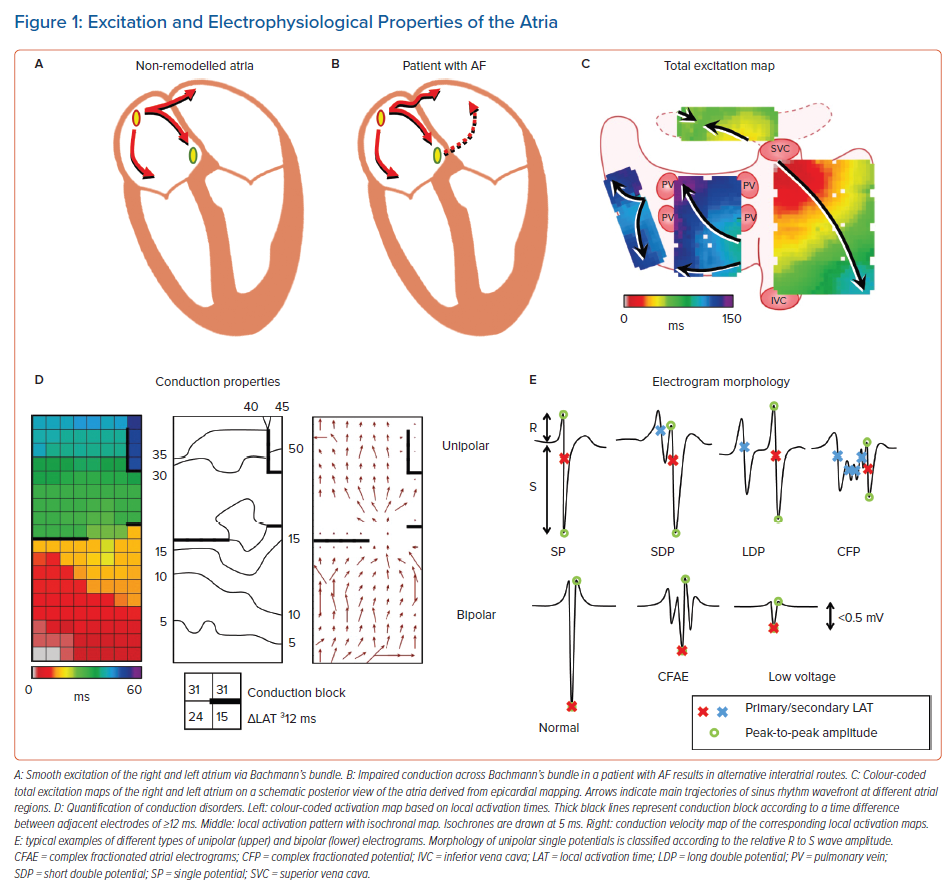
Spread of the SR wavefront is influenced by membrane properties, tissue structure and wavefront geometry.12,13 Conduction disorders are caused by structural atrial remodelling due to, e.g. (long-standing) pressure and/or volume overload, inflammation, atherosclerosis, myocardial ischaemia/infarction, interstitial fibrosis or an abnormal anatomy.14–18 Structural remodelling may lead to non-uniform tissue anisotropy and local disorders in conduction, such as slowing of conduction or conduction block (CB). Areas of CB (frequently defined as large activation time differences between two adjacent electrodes or the presence of double potentials) are thought to play a crucial role in the genesis and perpetuation of AF.12,19 The presence of lines of CB makes it more likely for reentrant circuits to develop, which may increase the likelihood of AF.20 Lines of CB affect propagation of the expanding SR wavefront and could be either structural or functional in nature.
Spach et al. demonstrated that ageing leads to greater changes in conduction when wavefront directions differ, leading to low-voltage, fractionated potentials.21 Wong et al. used CS pacing to assess electrophysiological features during wavefronts propagating in different directions.22 They observed that there was direction-dependent slowing of conduction, prolongation of total atrial excitation times and an increase in number and length of CB lines. These differences were more pronounced in patients with chronic atrial stretch and were associated with a greater susceptibility to develop AF. On the other hand, conduction abnormalities could also be rate-dependent. Huang et al. used CS pacing with cycle lengths varying between 1,000 and 250 ms and demonstrated that rate-dependent CB was present in 94% of patients with AF induction.23 However, by examining 339 atrial extrasystoles during epicardial mapping, Teuwen et al. showed that the incidence of conduction disorders was mainly associated with the degree of aberrancy but not with prematurity.24 Conduction abnormalities could therefore be hidden during normal SR, resulting in a possible underestimation of conduction disorders in studies that only focus on SR.
Conduction Abnormalities in Electrically Non-remodelled Atria
In patients with Wolff-Parkinson-White syndrome with non-dilated atria, Konings et al. were the first to demonstrate that the RA free wall of these near healthy hearts was activated uniformly by a single broad activation wave without any conduction disorders.25 However, Hansson et al. demonstrated in three out of 12 patients undergoing coronary artery bypass grafting (CABG; 63 ± 7.6 years) or surgical transection of an accessory pathway (55 ± 9.9 years) that epicardial mapping of the RA free wall during SR revealed small areas of conduction disorders, covering 2–12% of the total recording area.26 Moreover, the presence of areas of CB was also described at the junction of the right superior pulmonary vein (PV) and the LA in 18 patients (67 ± 11 years) without AF.27 In contrast, Lanters et al. demonstrated in 209 CABG patients (66 ± 9.6 years) with electrically non-remodelled atria that some degree of CB (median 1.3%, range 0.1–4.3%) was present in all patients.28 There was a considerable intra-atrial, but also inter-individual variation in prevalence of CB. However, a predilection site was present at the superior intercaval RA although it did not reflect CB elsewhere in the atria and had no correlation with the development of postoperative AF.
Conduction Abnormalities Predisposing to Postoperative AF
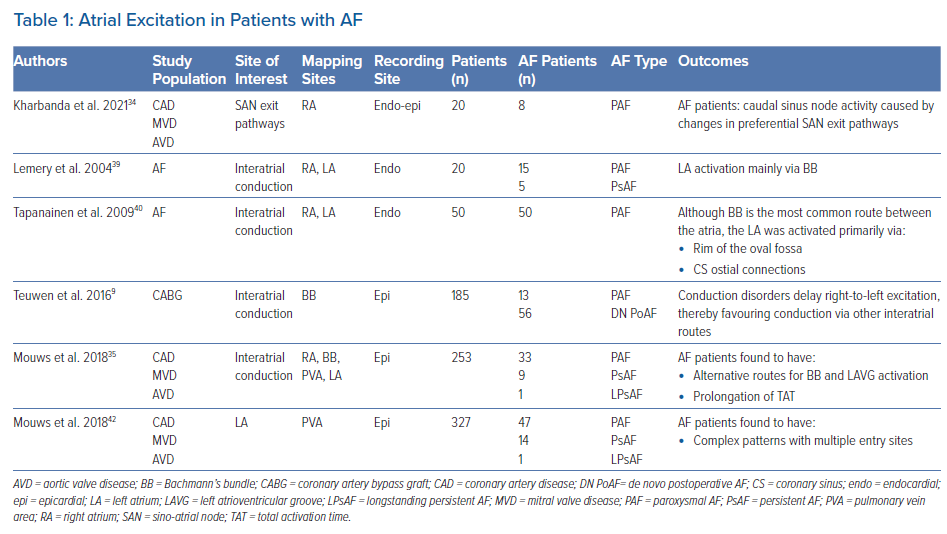
Various studies report on an association between CB during SR and development of AF. Sakamoto et al. performed intra-operative mapping during SR of the RA free wall in 52 patients with a variety of structural heart diseases.29 The presence of non-uniform activation patterns (defined as areas of CB or fusion of multiple wavefronts) was observed in 15 patients (29%) and was associated with development of postoperative AF. Kharbanda et al. examined the RA by simultaneous endo-epicardial mapping in 80 patients and found a relationship between transmural CB at the inferior RA and postoperative AF.30 Other atrial sites were also related to development of postoperative AF. By performing epicardial mapping at BB, Teuwen et al. found that a high amount (defined as >4% CB) and long lines of CB (defined as ≥12 mm) predisposed for early postoperative AF in CABG patients (Table 1).9
Two studies described the association between areas of CB during SR for intraoperative AF inducibility in patients without a history of AF. Roberts-Thomson et al. compared patients with atrial septal defects with control subjects and demonstrated the presence of conduction disorders in the LA and increased inducibility of AF in the study group.31 In 54 patients with structural heart disease without a history of AF, Van Staveren et al. found that longer lines of CB at BB were related to AF inducibility.32 These observations further support a relationship between the presence of conduction abnormalities and the development of AF.
Conduction Abnormalities Associated with AF Episodes
During SR, electrical activity originates from the SAN area and conducts to the atrial myocardium via several exit pathways.33 The presence of areas of CB around the SAN causes a blockage of these exit pathways leading to shifts of SAN exit sites. Kharbanda et al. demonstrated that the SAN exit pathway in patients with AF was located more caudally compared to patients without AF.34 By using simultaneous endo-epicardial mapping, they also demonstrated that conduction disorders at the RA were more pronounced in patients with a history of AF.30 In contrast, in an epicardial mapping study involving 253 patients with various underlying heart diseases, Mouws et al. demonstrated that although RA excitation during SR was prolonged in patients with a history of AF, there was no relation between the SAN exit site and total atrial excitation time.35
Previous studies have also demonstrated that patients with a history of AF have more conduction disorders in the RA and LA compared to patients without AF. In 268 patients with and without a history of AF, Mouws et al. showed that patients with AF more often present with continuous lines of CB located at the PV area.36 Heida et al. have demonstrated that patients with various underlying heart diseases and a history of AF had more conduction disorders than patients without AF throughout both atria.37 Van der Does et al. identified the lateral LA as a location with more conduction disorders in patients with valvular heart disease.38 In all aforementioned studies, disturbed conduction at BB during SR was most strongly correlated with the presence of atrial remodelling related to AF episodes (Supplementary Material Table 1).
Bachmann’s Bundle: A Key Player in Arrhythmogenesis?
BB is the preferential route of interatrial conduction. Lemery et al. performed endocardial mapping in 20 patients with either paroxysmal or persistent AF and demonstrated that LA activation occurred via BB in all patients.39 However, Tapanainen et al. demonstrated that although BB is the most common interatrial route, the LA was activated primarily via the rim of the oval fossa region at the interatrial septum or via the CS ostial connections in 15 out of 50 patients with paroxysmal AF.40 A limitation of these studies was that mapping was performed with a low spatial resolution in a small number of patients. Most importantly, BB was not included in these studies as mapping was performed only at the endocardial side.
In several studies it was demonstrated that BB is a predilection site for conduction disorders to occur.35,37,41 In an intraoperative epicardial mapping study, Mouws et al. demonstrated that total atrial excitation times were longer in patients with a history of AF compared to those without AF (136 ± 20 ms versus 114 ± 17 ms, p<0.001).35 This was mainly caused by longer total activation time of the RA and BB (RA: 73 ± 13 ms versus 67 ± 14 ms, p=0.018; BB: 106 ± 20 ms versus 87 ± 16 ms, p<0.001). This resulted in alternative routes for BB and left atrioventricular groove (LAVG) activation, as BB was activated either via one wavefront from right to left, from the central part or via multiple wavefronts. The LAVG was then activated via either BB, the PV area or via both routes, depending on which route had the shortest interatrial excitation time. An increased total activation time of BB was caused by the presence of extensive conduction disorders. Teuwen et al. indeed demonstrated that particularly long lines of longitudinal CB are more pronounced in patients with AF episodes undergoing CABG.9 The resulting delayed right-to-left excitation favoured conduction via other interatrial routes, such as the limbus of the oval fossa, the CS and interatrial bundles both superior and inferior along BB. As demonstrated by Mouws et al., a combination of conduction disorders and distinct parts of the SR wavefront entering asynchronously, the posterior LA can lead to an increased risk of AF.42 Conduction disorders giving rise to alternative propagation routes may be the result of damage to the thick and thin septa surrounding BB myocytes, considerably affecting interatrial conduction.43 This was further supported by the observation of Mouws et al. that LAVG excitation via only the PV area was considerably slower than via BB (90 ± 18 ms versus 101 ± 20 ms, p<0.001).35 Patients with either AF, LA dilation or mitral valve disease (MVD) had particularly longer total excitation times of the atria, which was mainly determined by impaired conduction along BB. Based on these observations it was suggested that total atrial excitation times are particularly affected by conduction disorders at BB and RA, which are likely related to the presence of AF. This was also demonstrated by Heida et al., who recently showed in a large cohort of 447 patients that a history of AF was associated with the slowing of conduction; patients with AF had more conduction times (CT) ≥4 ms (≈50 cm/s), especially at the BB, LA and PV areas.37 In addition, maximum CT for AF patients was larger than in non-AF patients. In the majority of studies, it was consistently demonstrated that an increased amount of conduction disorders at BB is present in AF patients. The highly organised architecture of BB could make this structure more vulnerable to structural remodelling and consequently disturbances in conduction that can even be identified during SR.
Pro-arrhythmic Features of Ablation-created Conduction Block
There appears to be a clear link between the presence of conduction disorders and the development of AF. However, CB can also be introduced during extensive catheter ablation procedures targeting complex fractionated EGMs or LVAs, for example. From a theoretical point of view, the resulting ablation lesions causing local CB may be involved in the initiation and perpetuation of AF. This is also the case if linear lesions were incomplete. Postoperative arrhythmias are not uncommon after AF surgery and are typically reentrant and related to the surgically created lesions.44 A combination of pre-existing conduction disorders and manually created lesions can therefore also provide additional substrate underlying AF recurrence.
Assessment of Cardiac Conduction Velocity
Cardiac conduction velocity (CV) provides important information on the properties of the underlying myocardium and is therefore widely used in electrophysiological studies. Changes in intercellular electrical coupling and tissue structure contribute to conduction heterogeneity and CV reduction, which in turn play a major role in the initiation and perpetuation of AF.21 However, there is no agreement over which is the best technique to compute CV.45 Calculation of CV is frequently based on a certain distance travelled by a propagating wavefront in a unit of time. This results in an accurate CV estimate if the propagation is uniform and the direction is known. A straightforward method to estimate CV is by using isochronal maps in which isopotential lines are drawn over a fixed time interval. The CV is then estimated by examining the distance travelled over a fixed time window. To also automatically include an estimation of the local propagation direction, a minimum of three electrodes is typically required to establish a velocity vector. Also, an adequate spatial resolution is required to minimise CV estimation errors, especially when working with complex and heterogeneous activation wavefronts. During standard electrophysiology studies, multi-electrode catheters enable CV estimation by techniques such as triangulation.45 Using regularly spaced high-density electrode arrays, simultaneous recordings on a high spatial resolution scale enable analysis of complex and heterogeneous patterns of activation by using techniques such as finite differences, polynomial surface fitting, discrete velocity vectors or omnipolar EGMs (O-EGMs).46,47 A disadvantage of the finite differences, polynomial surface fitting and O-EGM techniques is that they require data interpolation and smoothening, thereby masking local conduction heterogeneity.
Local CV can be estimated by triangulation using 3D electroanatomical activation maps. Using this methodology, Stiles et al. demonstrated that CV in patients with paroxysmal AF was especially lower at the RA and LA septal parts compared to controls with a left-sided accessory pathway (RA: 210 ± 50 cm/s versus 130 ± 30 cm/s, p<0.001; LA: 220 ± 40 cm/s versus 120 ± 20 cm/s, p<0.001).48 Prabhu et al. demonstrated that during CS pacing in patients with (long-standing) persistent AF, CV in the RA was lower compared to the LA (93 ± 15 cm/s versus 101 ± 19 cm/s, p=0.02), also particularly at the septal parts of the atria.49 Another study by Zheng et al. reported that during SR, the average CVs of the RA were lower in paroxysmal AF patients compared to controls with atrioventricular nodal reentrant tachycardia (60 ± 12 cm/s versus 83 ± 13 cm/s, p<0.05).50 Remarkably, CV estimates in this control group were much lower than CVs assessed in other studies.9,26,51 In addition, no differences were found between the septum and other parts of the atria. Although the triangulation methodology has been automated to generate high-density CV maps of clinically acquired data, studies focusing on CV comparison in AF patients are lacking.52
Teuwen et al. reported that CV (measured by using isochronal maps) across BB is about 90 cm/s in patients undergoing CABG, which was comparable with an average CV of 88 cm/s at the RA free wall in patients with Wolff-Parkinson-White syndrome and patients with ischaemic and/or valvular heart disease.9,26,46,53 However, in the case of local conduction heterogeneities, a more sophisticated method is required. Van Schie et al. Have developed a discrete velocity vectors methodology to estimate local CVs.46 It was demonstrated that patients with paroxysmal AF have slower conduction across BB (± 10 cm/s) during SR compared to patients without AF. In addition, more areas of slow CV (<30 cm/s) were found at the BB and PV area. Heida et al. recently reported similar observations in a case-control study of 34 patients with and without a history of AF.53 In a specific population of MVD patients, a history of AF was characterised by decreased CV and unipolar single potential amplitudes at BB due to loss of S wave amplitudes.54 Areas of slowed conduction have frequently been linked to low-voltage potentials, which formed the basis for current ablation strategies targeting LVAs for AF.12,55–57
Voltage Mapping Techniques
Structurally remodelled tissue gives rise to slowing of conduction or conduction disorders. These areas are frequently identified using the spatial distribution of EGM amplitudes, commonly known as voltage mapping. However, there is still a lack of consensus on how to accurately use voltage mapping to target the AF substrate and how to define abnormal voltage.58 Also, there are several voltage modalities which can be used such as unipolar, bipolar and multipolar (omnipolar/Laplacian) voltage mapping.59 In short, a unipolar EGM (U-EGM) is recorded as an extracellular potential difference between one single electrode on the tissue relative to an indifferent electrode, while a bipolar EGM (Bi-EGM) is simply the subtraction of two U-EGMs. Therefore, a U-EGM can be regarded as the sum of instantaneous current dipoles of a wavefront, reflecting cardiac electrical activity of the tissue surrounding the recording electrode. As the amplitude depends on the volume of simultaneously activated cardiac tissue, synchronous activation of the myocardium results in relatively large amplitude U-EGMs, whereas areas of asynchronously activated myocardium cause a decrease in U-EGM amplitudes.19
Although U-EGMs are more sensitive to far-field and remote activations, U-EGM potential morphology contains additional information on the progression of the wavefront.54 Nevertheless, Bi-EGMs are still predominantly used in clinical practice as Bi-EGMs are less sensitive to noise and represent more local information from the tissue between two electrodes. However, Bi-EGMs have high directional sensitivity, which is particularly important when targeting voltage abnormalities during stable SR.60 A so-called omnipolar mapping technique has been proposed to overcome this directional sensitivity. Using multiple neighbouring electrodes, O-EGMs are mathematically constructed to represent maximal bipolar voltage along the direction of a propagating wavefront.47 However, a major disadvantage of all voltage mapping techniques is their dependency on the electrode size, as larger electrodes result in lower voltages and consequently more LVAs in the tissue.61 It therefore remains difficult to directly compare study outcomes.
Bipolar Voltage Mapping
Several studies have shown local variation in bipolar voltages during SR, in which the majority of the studies focused on the LA only (Supplementary Material Table 2). In addition, all studies described regional voltage analyses as part of ablation therapy targeting LVAs. These areas are commonly defined as bipolar voltages ≤0.5 mV.62 Marcus et al. were the first to characterise regional differences in bipolar voltage during SR in 22 patients with paroxysmal AF.63 They demonstrated that AF patients exhibited significantly more LVAs in the septum and posterior LA walls compared to patients with focal atrial tachycardia. However, a major disadvantage of this study was that the AF patients were mapped with an 8 mm catheter, whereas all control patients were mapped with a 4 mm catheter. During pacing from the CS, Teh et al. demonstrated that patients with AF have circumscriptive areas of lower voltages, more LVAs, slowing of conduction and fractionated EGMs compared to age-matched control patients with a left-sided accessory pathway.64 These changes were more pronounced in persistent AF patients who were first cardioverted when they did not present in SR.
Two years later, Rolf et al. were then the first to describe the use of SR voltage mapping guiding AF substrate modification after circumferential PV isolation and demonstrated that LVAs occur more frequently in patients with persistent AF compared to patients with paroxysmal AF.4 Lin et al. also demonstrated a decrease in mean LA voltage and a higher incidence of LVAs during SR with progression of AF.65 Regional LA differences were studied in more detail by Kapa et al., who demonstrated that there was a heterogeneity in voltage distribution in all patients regardless of prior LA ablation.66 The highest voltage was found in the LA floor and lowest in the posterior LA wall adjoining the PVs, while Rodríguez-Mañero et al. found the highest values in the LA appendage.67 Kogawa et al. compared these regional differences between patients with paroxysmal or persistent AF during SR.68 They demonstrated that bipolar voltages were specifically lower at the LA septum, roof and posterior wall, right superior PV and its antrum, right superior PV carina and right inferior PV antrum in patients with persistent AF.
As AF therapy commonly targets in the LA, data on regional differences in bipolar biatrial voltage during SR is lacking. However, Stiles et al. showed that mean RA and LA bipolar voltage was reduced in 25 patients with paroxysmal AF compared with 25 patients with left-sided accessory pathways.48 More specifically, areas at the high-lateral RA, posterior LA and LA roof in AF patients were more likely to be LVAs. Although during CS pacing, Prabhu et al. demonstrated that global bipolar voltage did not differ between the RA and LA, but voltages were larger at the posterior LA compared to posterior RA in patients with (long-standing) persistent AF.49 Although specific regional differences in bipolar voltages are more recognised, cut-off values to identify LVAs are currently not customised to the different atrial voltage distributions. Despite ablation therapy based on bipolar LVAs possibly being beneficial in certain patient populations, the efficacy and long-term outcome remains controversial.56 It is for these reasons that U-EGMs are regaining popularity.
Unipolar Voltage Mapping
Unlike Bi-EGMs, U-EGMs are directionally independent and provide additional information on wavefront progression. Remarkably, studies focusing on unipolar voltage distribution during SR are still lacking, although the use of U-EGMs has regained interest in clinical practice. Using biatrial electroanatomical mapping, Prabhu et al. demonstrated that unipolar voltages were higher in the LA compared to the RA in patients with (long-standing) persistent AF during CS pacing (2.95 ± 1.14 versus 2.28 ± 0.65 mV, p=0.002).49 More specifically, unipolar voltages were particularly higher in the posterior, lateral and septal parts of the LA.
Another U-EGM voltage parameter was introduced by Lin et al., who used peak negative voltages to study the voltage distribution in patients with paroxysmal AF compared to other supraventricular tachycardia.69 These peak negative voltages are defined as the negative portions of U-EGMs. They demonstrated that global RA peak negative voltages were reduced and more heterogeneously distributed in AF patients compared to patients with either atrioventricular nodal reentrant tachycardia, focal atrial tachycardia or atrial flutter. Van Schie et al. have demonstrated that unipolar voltage is lower in areas of slowed conduction or CB, or areas containing fractionated potentials, which might indicate areas of arrhythmogenic tissue.70 In this study, unipolar LVAs were found in all 67 patients with MVD with and without a history of paroxysmal AF, although lower voltages and more LVAs were found at BB in paroxysmal AF patients. There were no predilection sites for low voltages to occur. Patients with paroxysmal AF were also characterised by decreased single potential amplitudes at BB due to loss of S-wave amplitudes together with a decreased CV.54 Remarkably, no further studies are available focusing on unipolar voltages during SR. Recently, Van Schie et al. demonstrated that bipolar LVAs can still contain large unipolar voltages and high CVs.60 Future studies could therefore focus on the combination of unipolar and bipolar voltages to improve voltage-guided ablation therapy.
Use of Electrogram Morphology and Fractionation
Another parameter of potential morphology includes potential fractionation. However, it remains unclear how fractionated potentials need to be defined as many different definitions and recording methodologies have been introduced.71 Although fractionated EGMs are frequently linked to LVAs and slowed conduction, Viles-Gonzalez et al. demonstrated that fractionation during SR is also found in areas characterised by normal voltages and CV.72 Nevertheless, fractionation is still commonly used to identify arrhythmogenic substrate with either U-EGMs or Bi-EGMs. However, fractionation can also occur during SR in patients without electrically remodelled atria, although it is more frequent in patients with AF.73
While potential annotation in U-EGMs is quite straightforward, Bi-EGM annotation is more complex, particularly when identifying complex fractionated potentials. It is therefore not surprising that no predilection sites for fractionation or differences in the degree and spatial distribution of fractionation between patients with paroxysmal or persistent AF could be found in a large review of 84 studies targeting mostly Bi-EGM, complex fractionated EGMs.74
Fractionation of U-EGMs, on the other hand, has been studied less extensively. In the late 1990s, Konings et al. described a classification of U-EGMs based on the number of negative deflections, which is easy to measure, especially during SR.75 Van Schie et al. have demonstrated that MVD patients with paroxysmal AF had more unipolar fractionated potentials at the PV area compared to those without a history of AF.70 However, fractionation can also be a consequence of variation in the anatomy of the atrial wall and therefore functional anisotropy. U-EGM and Bi-EGM fractionation has also been linked to asynchronous activation of the endo- and epicardium, which may be a significant mechanism for the persistence of AF.76–78 Van der Does et al. demonstrated a moderate-high sensitivity (65–78%) for areas of electrical asynchrony between endo- and epicardial layer for U-EGM and Bi-EGM fractionation.77 However, fractionation could not only be explained by local endo-epicardial differences in fractionation, but also by inhomogeneous conduction patterns in solely the endo- or epicardial plane. However, whether EGM fractionation therefore represents a proper target for ablative therapy remains questionable.
Endo-epicardial Asynchrony and Breakthrough Waves
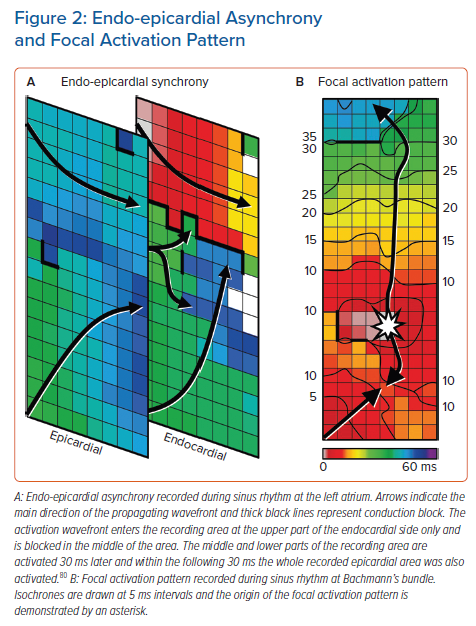
Endo-epicardial asynchrony (EEA) and breakthrough waves do not only exist during AF but also during SR, particularly in areas with a thicker atrial wall.79 The presence of intramural conduction disorders may enhance EEA (Figure 2). Kharbanda et al. were the first to demonstrate that patients with (long-standing) persistent AF already have more EEA during SR in the inferior RA compared to those without AF.30 This was also linked to a higher amount of conduction disorders in that area. Kharbanda et al. also demonstrated in a case report that extensive EEA was present in the LA in three patients with paroxysmal AF.80 Although this study included only three patients, the highest degree of EEA was found in the patient with the longest history of AF. This indicates that even during SR the degree of EEA could indeed be related to AF duration and that early intervention may prevent progression of AF.
Enhanced EEA may result in transmural propagation of waves which breakthrough in the opposite layer. These sites can be identified as focal activation patterns (FAPs). These FAPs occur frequently during AF and they are the key elements of AF-related electropathology.81,82 FAPs are not only present during AF, but also during SR. Mouws et al. demonstrated that epicardial FAPs are present in over a third of patients at various sites in the RA, LA and BB, particularly in thicker parts of the atrial wall.83 There was also a clear difference in R/S ratio between unipolar potentials recorded at SAN-FAP sites and other epicardial FAPs; SAN-FAPs were more often characterised by a full S wave morphology, while other FAPs consisted more often of an RS or rS wave morphology. This could indicate that muscular connections between the endo- and epicardium underlie FAPs and that a slight degree of EEA is already enough for FAPs to occur in some areas during SR. As the incidences and spatial distribution of these FAPs during SR were similar between patients with and without history of AF, most of these FAPs could be based on anatomical substrate and therefore be physiological. It is likely that further aggravation of structural remodelling enhances local conduction disorders and EEA, facilitating transmural propagation of wavefronts and hence the development of AF. In addition, AF-induced remodelling may further facilitate EEA and enhance the occurrence of FAPs during AF, thereby promoting AF persistence. When a more extensive arrhythmogenic substrate is present in the atria, ablative therapy is more likely to fail.
Clinical Implications and Future Directions
During SR, several electrophysiological parameters have been identified as indicators of AF-related electropathology. These indicators were not only found at the LA, but also at the RA and even more frequently at BB. This clearly indicates the presence of AF-related electropathology outside the LA, confirming the hypothesis that AF is not just a solely left-sided disease. Even during SR, electropathology may be missed when mapping is performed only at the endocardium or epicardium. Hence, conduction is 3D and complex even during SR. Remarkably, patients with AF already have more electropathology detectable during SR compared to patients without AF, particularly at BB. However, which parameters are most suitable as indicators for this purpose remains unknown. It also remains unclear whether electropathology is a cause or consequence of AF. Certainly, AF itself can also contribute to a certain amount of electropathology. On the other hand, electropathology can be manually introduced during catheter ablation therapy. To investigate whether electropathology during SR is associated with AF, the next step in mapping is to correlate quantified electrophysiological parameters during SR with parameters measured during AF at same site. Once AF-related electropathology is identified, it can be used as an electrical marker to guide ablative therapy of AF.
Click here to view Supplementary Material.
Clinical Perspective
- Progression of AF is accompanied by structural and electrical remodelling, which results in complex electrical conduction disorders defined as electropathology.
- AF-related electropathology is not only confined to the left atrium, but it is also present in the right atrium and at Bachmann’s bundle.
- Patients with AF already have more electropathology detectable during sinus rhythm compared to patients without AF.