


Despite advances in mapping and ablation, the long-term success of ventricular tachycardia (VT) ablation is moderate at best.1 The high recurrence rate could be attributed to either the evolving scar or inadequate ablation of pre-existing potential scar channels. Substrate-based ablation strategies have been shown to be as equally effective as activation mapping, which is often limited by haemodynamic instability and non-inducibility.2
Substrate ablation is often based on late potentials (LPs) and local abnormal ventricular activities (LAVAs). However, the conducting channels critical to VT induction/maintenance need not be active during sinus rhythm mapping. Decrement-evoked potential (DeEP) mapping is a method to unmask these critical channels and to identify those with the potential for unidirectional block to initiate tachycardia. The latest consensus document on VT ablation recommends DeEP mapping for substrate-based ablation.3
In the current era of high-resolution mapping, detailed mapping of activation wavefronts in the arrhythmia circuit is feasible. The new multielectrode catheters offer a new perspective on detailing the activation maps during sinus or paced rhythm to identify regions of slow conduction. Isochronal late activation mapping (ILAM) is one such novel method to identify areas of slow conduction during sinus rhythm.4 However, exact relationship of the areas of slow conduction to critical zones of re-entry and their ability to define ablation targets has not been clarified with a multicentre validation study.
The functional substrate mapping technique of ILAM also assumes that the slow conduction zones in sinus rhythm correspond to the critical isthmus in VT. This does not take into account the pivotal role of the initiating premature ventricular contractions (PVCs) and functional substrate in the induction of VT. Furthermore, the areas with slower conduction have an activation site dependency.5
A strategy that increases the specificity of signals to better identify functional substrate that interacts with potential triggers (with or without an activation map) would be of inherent value. This technique would need to identify sites that initiate the re-entry and the critical components of the VT circuit. This is the role and strength of DeEP.
DeEP mapping identifies the components of diseased myocardium that are more likely to be critical to initiating or maintaining the VT circuit. This is achieved by delivering an extra stimulus and comparing the local activation delay during steady-state conditions (S1) and after the extra stimuli (S2). A decrement of more than 10 ms in the local electrogram (EGM) component has been proven to be highly specific for the detection of the critical sites of the VT circuit and thus provides a mechanistic target for substrate-based ablation.
In this review, we focus on the birth of this concept from seminal panoramic intra-operative mapping of VT circuits, then take the concept back to the basic laboratory in silico model to understand the mechanism, followed by a prospective validation in a multicentre VT ablation trial. We also review other works that share similarities to this concept. Importantly, we discuss the potential of DeEP mapping in the atrium where there is a significant need over and above pulmonary vein isolation (PVI) to decrease AF burden.
Validation of Decrement-evoked Potential Mapping
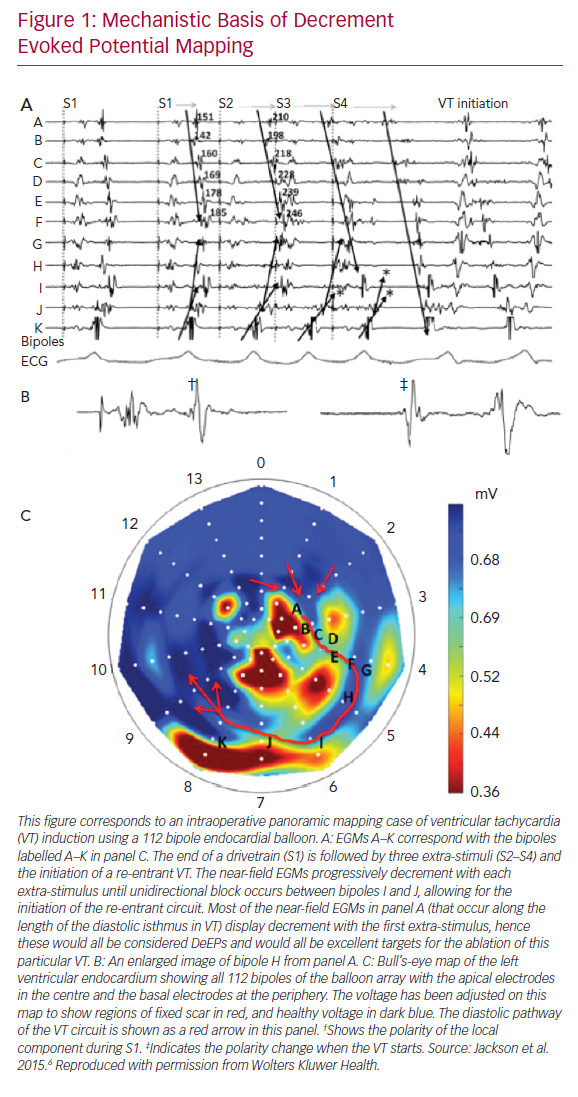
The concept of DeEP mapping was born from the understanding that the initiation of a re-entrant VT circuit is dependent upon delayed or decremental conduction through a critical zone of tissue.6 If this slow conduction occurs adjacent to a site of unidirectional block, then a re-entrant circuit may develop.7 The concept of linking EGMs that identify regions displaying decremental conduction to the initiation and maintenance of VT is shown in Figure 1.
The principles of the DeEP mapping strategy were initially examined using these simultaneous panoramic endocardial maps from intraoperative VT cases. These cases showed global activation of the left ventricular endocardium during a pacing train from the right ventricular apex, an extra-stimulus and VT.
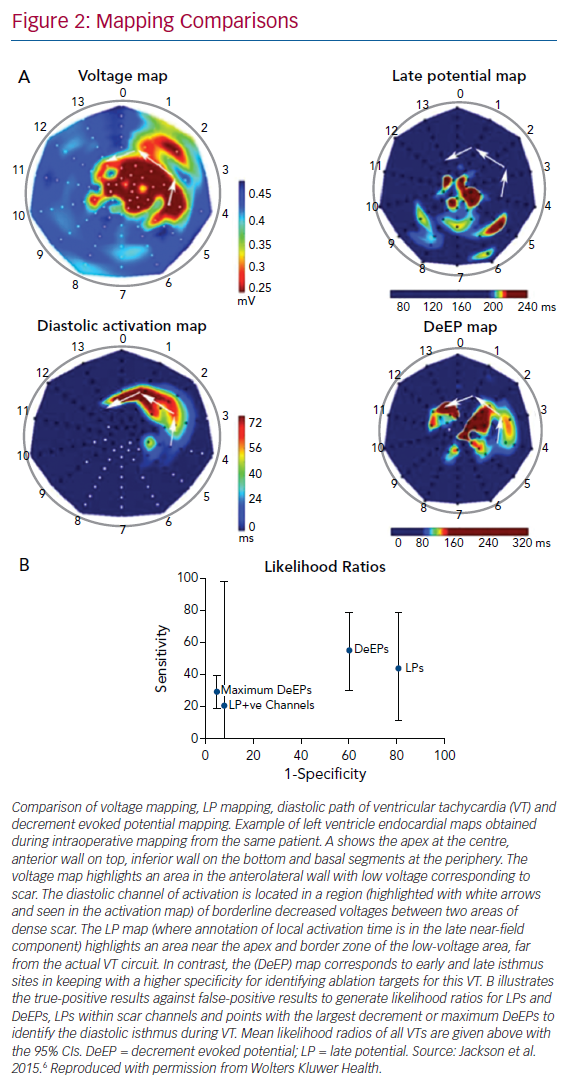
Jackson et al. examined six hearts (nine VTs) that had undergone simultaneous panoramic mapping for VT induction.6 In each case, a substrate (or voltage) map was created to identify regions of fixed conduction block during right ventricular pacing, an activation map of the VT circuit was created to identify the critical isthmus, an LP map was created by highlighting any regions with local activation occurring beyond the end of the QRS and a DeEP map was created to highlight any regions of the myocardium where components of the local EGM displayed decrement following a single extra-stimulus. These maps were then compared to determine the sensitivity and specificity of DeEPs to the critical isthmus of the VT circuit (Figure 2). In this study, the mean sensitivity for identifying the critical isthmus in VT was 50 ± 23% for DeEPs and 36 ± 32% for LPs (p=0.31). The mean specificity was 43 ± 23% versus 20 ± 8% for DeEP and LP mapping respectively (p=0.031). Further to this, the EGMs that displayed the greatest decrement in each case had a sensitivity and specificity for the VT isthmus of 29 ± 10% and 95 ± 1%, respectively.6
This study showed DeEPs had better specificity than LPs for identifying the VT isthmus.6 Additionally, in silico simulations showed that conduction velocity restitution magnified by zig-zag conduction in diseased areas of myocardium could be the underlying mechanism for DeEPs. In this way, the authors were able to show that a mechanistic strategy that looked at functional aspects of the substrate with a single extra-stimulus was able to refine the conventional targets of VT ablation (LAVAs) to a more focused strategy. Based on data from high-resolution mapping of swine VT circuits, areas with the slowest conduction where decrement is likely to occur may correspond to wavefront curvature or changes in myocardial fibre orientation.8,9
In Silico Modelling of Decrement-evoked Potential
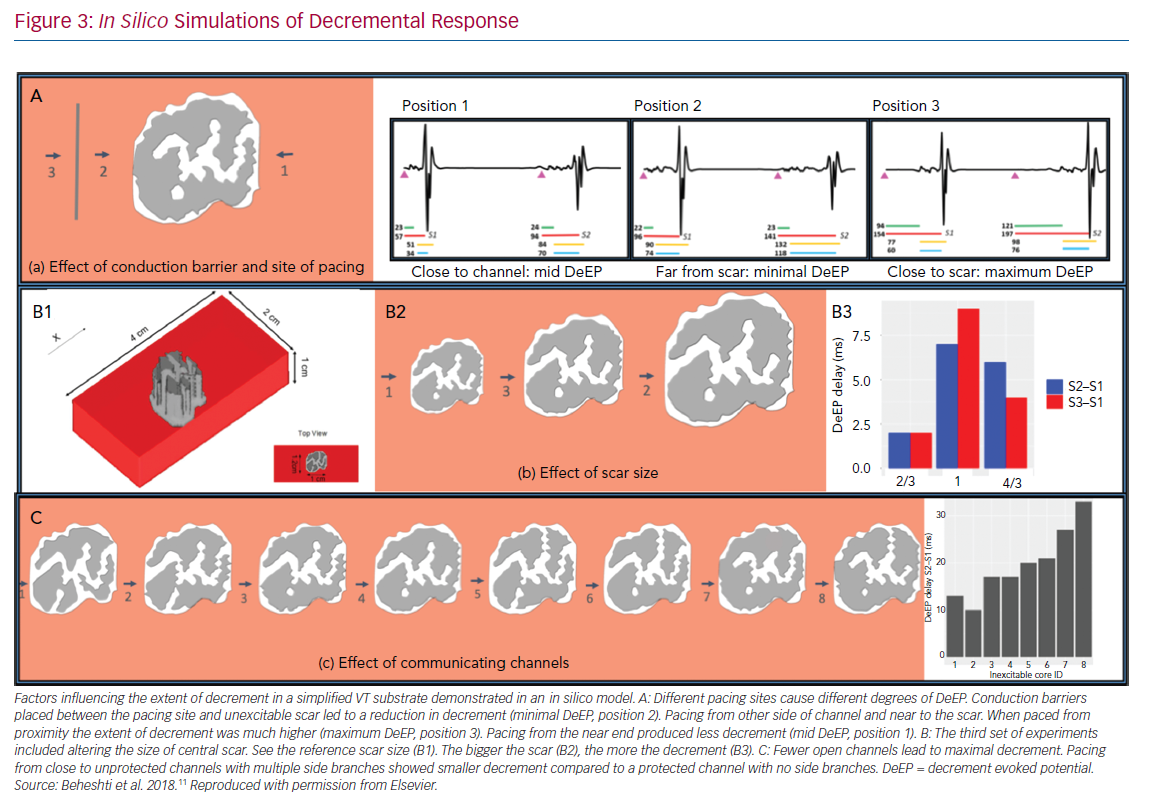
The physiological variables that could affect the presence and extent of decrement had to be defined. The objective of this back-to-bench strategy was to understand the effect of multiple pacing parameters on the degree of decrement, i.e. the proximity of pacing to the conducting channels in the unexcitable scar, the number of conducting channels in the scar, the size of scar, the effect of multiple extrasystoles and the direction of engagement of the channels. Validation with an animal or human model of such a number of variables is not feasible so a computer model was used in the study by Beheshti et al.10,11
We simulated a ventricular myocardial slab of 40 mm × 20 mm × 10 mm with an unexcitable core with a conductivity of 0.1 S/m. The ‘scar’ extended from epicardium to endocardium with a thin rim of conduction tissue outside (Figure 3) and it contained five conducting channels running towards a central isthmus. These channels could be opened or closed as desired. The pacing sequence of S1–S2 was simulated. The main findings were: pacing in close proximity to the scar maximised the amount of decrement (Figure 3A); pacing close to the opening of the channels induced less decrement (Figure 3A); the larger the size of the scar the larger the decrement (Figure 3B); a fewer open conducting channels led to higher decrement (Figure 3C); and the addition of S3 did not cause increased decrement.
Current evidence points to the crucial role of decrement in local potentials for the induction and maintenance of scar related-VT.11 The clinical implications of these findings are: isolated right ventricle (RV) pacing for VT induction might be insufficient to produce decremental potentials; and different sites of programmed ventricular stimulation (such as the RV apex, the right ventricular outflow tract and multiple left ventricular sites) could be used to allow the wavefront to engage the scar from different directions and so alter the decrement in the local tissue. This may be useful in patients with left ventricular leads for cardiac resynchronisation, as this lead could be used as an alternate site that may be more effective for inducing VT depending on the location of the patient’s scar and critical isthmus. Anter et al. also found that areas of slow conduction with isochronal crowding can dramatically change with different pacing sites and this is consistent with our modelling studies.5
Clinical Validation with a Multicentre Ventricular Tachycardia Ablation Trial
Many substrate-based ablation strategies have been described and used in the past to render patients VT free. Those strategies consisted initially of intraoperatively peeling the whole endocardium responsible for the VT circuit.12 This was followed by the development of catheter-based strategies that were initially focusing on activation mapping that allowed the VT isthmus to be identified and targeted in patients with haemodynamically stable, mappable VT.
The fact that many patients were experiencing breakthrough arrhythmia episodes during follow-up led to widespread use of substrate-based strategies, some of them targeting LAVA, and others encircling the substrate to try to electrically isolate the scar or else the use of more aggressive endo-epicardial scar homogenisation strategies.13–15 Those strategies, albeit with clinically proven benefit, have lacked the ability of focus the ablation in areas that are truly responsible for the initiation or maintenance of the VT circuit. As such, they lead to ablation of areas of still functional myocardium that could be playing a completely passive role.
In contrast with the tendency to ablate large areas of myocardium with abnormal signals, the finding of the higher sensitivity and specificity of the DeEP areas in identifying the critical VT substrate led us to design a focused strategy in a multicentre setting where areas with DeEP properties would be targeted first with radiofrequency (RF) then re-inducibility of VT would be tested.
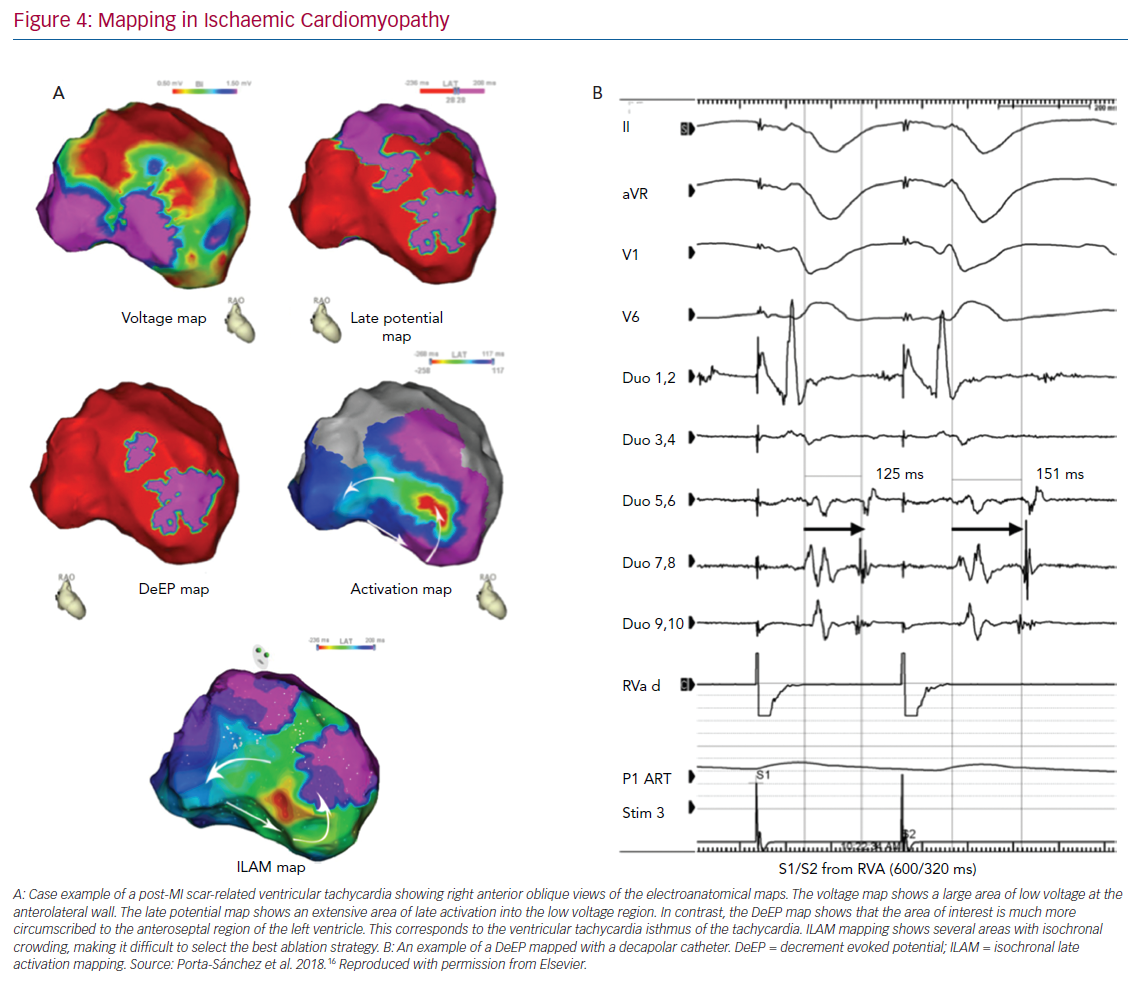
The objectives of the study were twofold: to establish whether the methodology for DeEP mapping with an extra-stimulus is feasible with current electro-anatomical mapping tools; and describe the mid-term results of a DeEP-guided ablation strategy in terms of VT burden. The study included 20 consecutive patients in three institutions.16 Substrate maps were created during RV pacing or sinus rhythm. Late potentials were identified via a multi-electrode mapping catheter (16 patients) or a 3.5 mm tip catheter, and were defined as potentials with complex high frequency or multicomponents after or at the QRS offset. For all the points showing LPs, a systematic assessment for local decrement was performed with a drive train (S1) from the RV at 600 ms with a single S2 (coupled at 20 ms above the ventricular effective refractory period [VERP]).
Those areas were tagged in the mapping system and, in 13 VTs, the activation map of the tachycardia was carefully constructed with high density maps (Figure 4). With that information, we were able to identify which proportion of DeEPs were co-located with the isthmus of VT. The main difference with other studies was that only areas with DeEPs were targeted with RF ablation. Reinduction of VT was performed after DeEPs were eliminated. If VT was still inducible, other targets were ablated.
Patient characteristics were typical for a VT ablation cohort: the mean age was 65 ± 17 years, the left ventricular ejection fraction was 33.4 ± 11%, 95% were men, 90% had a New York Heart Association classification of I–II, 40% were on two antiarrhythmic drugs and six were in VT storm (30%). Mapping showed that conventional LPs accounted for 17% of the myocardium mapped (IQR 8.9%–75%) and DeEPs accounted for 4.8% (IQR 2.2%–26%); p<0.001).
Most patients (80%) became non-inducible by targeting the DeEP areas only and further RF in those still inducible did not change the inducibility rate. RF time was low, with a mean of 31 minutes ± 21 minutes. The median (IQR) VT episode burden 6 months after the procedure was 0 (IQR 0–2) and it was 11 (IQR 5–25) 6 months before it. When the locations of LPs and DeEPs with respect to the critical VT regions were assessed, it was found that the area under the ROC curve for DeEPs (0.86; 95% CI [0.82–0.88]) was significantly higher than that of LPs (0.79; 95% CI [0.75–0.82]). These findings indicate that DeEPs have a higher specificity than LPs for the detection of critical VT sites during stable rhythm than LPs and also encompass a smaller region of the myocardium.
The main messages of this study were: DeEP mapping was a safe and effective strategy to differentiate the critical regions of the VT circuit during stable rhythm with current electro-anatomical mapping technology; a limited and focused RF ablation strategy yielded the majority of patients non-inducible and showed mid-term results comparable with other contemporary ablation strategies; DeEPs provide higher specificity than conventional LPs obtained during stable rhythms. These findings are of significant importance to enhance the capacity of the electrophysiologist to differentiate critical areas of the VT substrate from passive ones.
Workflow Considerations
Manual construction of DeEP maps using multi-electrode catheters is time consuming. Therefore, current efforts are directed at automating this process. Recent advances in technology such as the ‘replay’ algorithm of CARTO (Biosense Webster), the ‘turbomap’ feature of NavX Ensite (Abbott) and the customised mapping window of the Rhythmia HDx (Boston Scientific) mapping system could aid in the creation of DeEP maps.
Window of Interest and Annotation Criteria
DeEP mapping might appear cumbersome initially. The key technique is to localise the areas of LPs initially and then to follow that up with an S1–S2 sequence. To identify LPs and DeEPs, the window of interest needs to be set at the terminal portion of the QRS to ensure that only the local EGM is annotated and the far-field activation is not tracked by the automated algorithm. If permitted by the system, annotation of the latest deflection of the local EGM is preferable (as this is easiest for an automated system to do consistently). Manual review of the automated annotations is often required to ensure precision.
Creation of S1 and S2 Maps
All mapping systems allow additional mapping on previously acquired signals. A practical method to compare the activation pattern of both maps would be to create the S2 map initially and then move the window of interest to the preceding S1, which is the final stimulus of the drive train to annotate the LPs.17 Automatic repetition of the pacing sequence of the drive train followed by an extra stimulus while the substrate map is being performed would be the most time-efficient method.
Comparison of S1 and S2 Maps
The areas of DeEPs are usually a smaller subset of the areas with late potentials. This provides an opportunity to narrow the area of interest to the critical components of the VT circuit.
Manual Annotation of Late Potentials and Decrement-evoked Potentials
It goes without saying that, despite using automated algorithms, one has to verify the accuracy of the annotations during the S1 and S2 mapping to confirm the presence or absence of DeEPs. Another option is to manually annotate the local EGMs, which is less susceptible to errors and could provide accurate maps; however, this is time consuming.
Possible Application of Decrement-evoked Potential to Atrial Substrates
Haïssaguerre et al. showed pulmonary vein triggers to be frequent initiators of AF and this has led to the ablation strategy of pulmonary vein isolation.18 Although this had moved from ostial to antral lesion sets, it has remained the primary strategy for AF ablation up to the present time. Indeed, there is randomised data showing no additional benefit of ablation strategies with roof and mitral isthmus lines, or complex fractionated atrial EGM targeting in addition to pulmonary vein isolation in reducing the rate of recurrence of AF.19,20
The search for strategies to identify additional targets for AF ablation continues. Atrial myocardial thickness is less than one-third that of ventricular myocardium, at approximately 1–4 mm on average.21 Surprisingly in this thin-walled tissue, there is evidence for electrical dissociation between layers of the atrial endo- and epicardium, as well as heterogeneity in conduction in different regions.22 Atrial arrhythmia is promoted by early functional and then structural changes in this tissue. Probably, the first known description of decrement preceding atrial re-entry was described by Lammers in 1992.7 This has been overlooked and needs further developmental work for application in the atrium using the DeEP protocol.
The application of DeEP mapping to atrial tissue shows promise. Indeed, there are published cases of successful intra-atrial re-entrant tachycardia (IART) ablation using DeEP mapping to locate involved tissue that corresponded with earliest activation but did not correspond with LPs mapped without the use of extra-stimulus pacing. The circuit in IART may share characteristics with that in ventricular tachycardia given there are areas of fixed scar and routes for conduction within or around this.23 The lack of easily mappable, targetable, low-voltage areas in many cases of AF make functional mapping of the atrial substrate an appealing approach.
Regions participating in the initiation and/or perpetuation of AF outside the pulmonary veins are likely to display the properties of conduction delay, block and re-entry which can be identified by applying DeEP mapping to atrial tissue. Analogous to ventricular tissue, atrial tissue forming a critical part of the AF substrate may be identifiable with DeEP mapping.16 Recent studies have further explored the presence of endo-epicardial dissociation seen in atrial tissue, which may be brought out to an even greater extent with extra-stimulus pacing.24,25 This functional change in atrial activation patterns is likely reflected in the difficulties shown mapping unstable atrial activation patterns in AF.26 DeEP mapping may play a role in unmasking the substrate that facilitates the chaotic, three-dimensional movement of wavefronts during AF.
Comparison with Other Extrastimuli Strategies and Future Perspectives
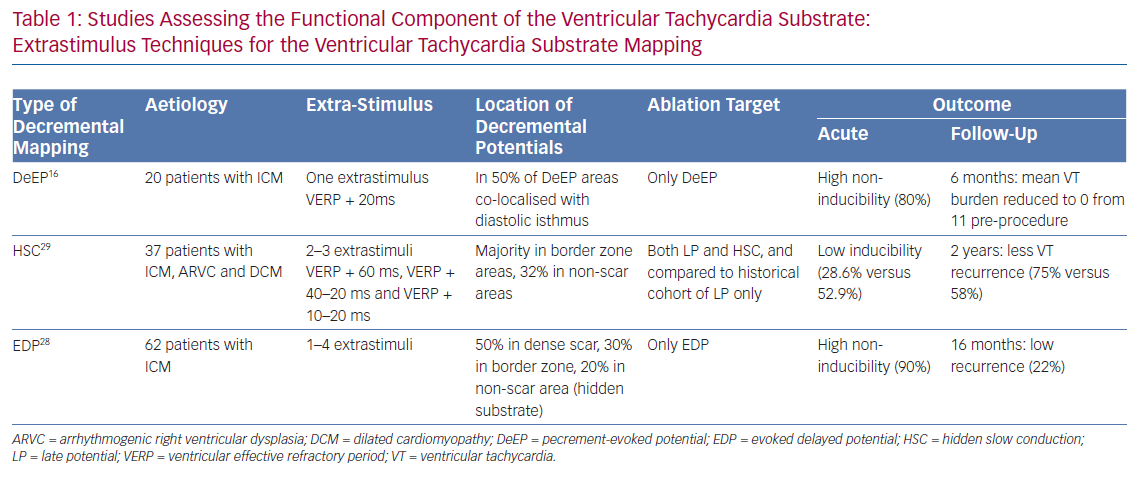
Since the first published description of decremental mapping for the facilitation of VT ablation in 2015, there have been three more published clinical series.6 Our group published our initial clinical experience with DeEP mapping for VT ablation in March 2018 and, in the same month, de Riva's group published their initial patient data, followed by Acosta’s group with their initial experience and a follow-up 2 years later.16,27–29 Although these studies shared some similarities, there were important differences in methodology and ablation strategy (Table 1).
The study by Acosta’s group included 37 patients, mostly post-infarction patients but one-quarter of these patients had other diagnoses, such as arrhythmogenic right ventricular dysplasia and dilated cardiomyopathy.29 They referred to the decrementing potentials as ‘hidden slow conductions’ (HSCs). An HSC was defined as the local EGM that decremented a minimum of 10 ms with double extra stimuli during programmed stimulation. They chose the ventricular effective refractory period (VERP) + 60 ms on S1 and VERP + 40–20ms on S2. If block was observed, the coupling interval was prolonged until conduction occurred and, in situations of uncertainty (when conduction was not delayed), they added a third extrastimulus. With this relatively aggressive protocol, they managed to induce sustained VT in only three patients, and those were terminated with antitachycardia pacing or direct current cardioversion. This protocol is quite different from ours regarding both the number of extra-stimuli and the length of the coupling interval.
Acosta et al. performed pacing only when a suspected HSC was seen and, in a third of those signals, they could confirm decrement. For a quarter of the signals, a third stimulus was necessary to demonstrate decrement. They noticed HSCs in 57% of patients with a median of eight HSCs per patient. They observed more HSCs in ischaemic patients and in smaller scars with less late potentials, a feature noticed by others as well. In addition, they noted more HSCs in heterogenous scars than in large homogenous scars. Their ablation strategy was to target suspected channels using voltage mapping or as demonstrated by late potentials (LPs).
In patients with HSCs, they added further ablation to these areas, which in the vast majority were outside the presumed channels and would have not been targeted by their standard ablation strategy. The patients with HSC ablation had shorter total RF times (17 minutes), presumably because of smaller scars and fewer LPs being surrogates for potential channels. More patients with HSC were rendered non-inducible after the initial ablation but, after further mapping and ablation, the results were similar at the end of the procedure as well as during follow-up.
In the two other studies, a strategy that initially targeted the decrementing potentials was used, so it is difficult to tease out the potential added benefit of HSC ablation.28,29 As a complement to the electrical data, Acosta et al. also added some insight gained from MRI scans obtained before the procedure, and could demonstrate that the HSCs were located in areas in the dense scar or border zone, even though the EGM voltage was normal (>1.5 mV).29
A study on an extended cohort of patients with longer follow-up has been recently published by the same group and compared to a historical cohort; this has shown that targeting the HSC seems to be associated with less VT during follow-up.29
This is a feature noted by de Riva's group, who studied 62 post-infarction patients referred for VT ablation.28 Two patients had to be excluded because they were intolerant to the pacing protocol. They mapped the infarct area with a pacing protocol of S1= 500 ms and set S2 at VERP + 50 ms. They targeted ablation signals that showed a near-field component that was <1.5 mV and displayed decrement or block with the pacing protocol. Late potentials that did not display these findings were not targeted for ablation. In their study, a third of all signals from the infarct area were decrementing and were termed ‘evoked delayed potentials’ (EDPs); about 20% of those were in normal voltage areas adjacent to the scar. All but four (7%) patients displayed EDPs.
The authors had MRI data for a small subset of patients, and observed that the EDPs came from areas with relatively normal voltage and were mostly located in non-transmural scar areas. On average, they ablated only for 15 minutes with a rigorous endpoint of loss of capture at that site. Almost 70% of patients were non-inducible after EDP ablation only, and an additional 23 were non-inducible after further ablation based on conventional mapping.
Our protocol and study differed significantly from other studies in several aspects:
- A simple pacing (S1 = 600 ms) and extra-stimulus protocol (S2 = VERP + 20 ms) were used.
- Multielectrode catheters were used in 80% of the cases.
- DeEP mapping was performed only in areas with late potentials.
- Mechanistic evidence of the value of DeEP mapping was provided by demonstrating that in 50% of patients (13 VTs), DeEP areas and not LPs correlated well with the diastolic pathway of the VT circuit. The abolition of this resulted in better clinical results.
DeEP mapping, regardless of the protocol chosen, will be invaluable in cases where VT induction is either impossible or not feasible. Multielectrode catheters will be increasingly be used in these circumstances and this will facilitate the procedure further; this may also elucidate targets in the vicinity of the mapped area as critical areas for successful ablation. Attempts are under way to automate and incorporate this concept into contemporary 3D mapping technology with multi-electrode catheters.
Conclusion
DeEP mapping is a substrate-based mapping strategy established on the foundation of robust mechanistic evidence and has been prospectively validated in a multi-centre human trial.
This functional assessment of the VT substrate adds to the conventional mapping of local abnormal EGMs during VT ablation. Unlike local abnormal EGMs, however, DeEP sites have been proven to participate in initiation and maintenance of re-entrant arrhythmias, which obviates the need for extensive substrate ablation.
The evidence for the efficacy of this strategy in VT ablation comes from a multicentre patient cohort, but further validation in larger randomised trials with automated software in 3D mapping systems will be important. The utility of DeEP mapping in atrial flutter and AF ablation is still to be elucidated and such efforts are under way.
Clinical Perspective
- Decrement-evoked potential (DeEP) mapping is a strategy for VT ablation without inducing VT.
- If tachycardia remains inducible after DeEP, other methods of substrate ablation can be explored.
- Automated algorithm incorporation into electro-anatomical mapping systems could allow DeEP mapping to integrate into the workflow seamlessly.
- In AF ablation and atypical atrial flutters, DeEPs could be targeted where they identify the tachycardia isthmus or at areas capable of local re-entry, without time-consuming extensive mapping and annotation.