


Idiopathic ventricular arrhythmias (IVAs) comprise a spectrum of arrhythmias (the mechanisms of which are presumably not related to myocardial scar or ion channel disorders), that can, occasionally, occur in patients with structural heart disease.1 The most common forms of IVA come from the right ventricular outflow tract (RVOT) and the left ventricular outflow tract (LVOT) in 60% and 20% of patients, respectively, but there are other sites of origin such as the atrioventricular annuli, papillary muscles1,2 and moderator band,3 which account for approximately 20% of IVAs.
In the RVOT, the septum is a more common site of OT-VA origin than the free wall. The LVOT-VAs originate from structures in close anatomical proximity: the aorto-mitral continuity (AMC), the anterior sites around the mitral annulus (MA), the aortic sinus cusp (ASC) and the epicardium.4,5
The IVAs are considered benign ventricular arrhythmias, but OT-VA can lead to serious adverse sequelae such as premature ventricular contraction (PVC)-induced cardiomyopathy, impaired quality of life, incessant ventricular tachycardia (VT) and sudden cardiac death.6 Usually these VAs are asymptomatic but sometimes patients report palpitations, chest pain, presyncope and, rarely, syncope. In view of the origin from a single ventricular site, these arrhythmias can be treated using discrete ablation lesions.7 Indeed, catheter ablation is accepted as a highly successful first-line therapy for OT-VAs originating from the RVOT (class I recommendation), and a treatment for VAs from endocardial and epicardial LVOT when anti-arrhythmic medication is ineffective, not tolerated or not the patient’s preference (class IIa recommendation).7
OT-VA has a focal origin and displays a single dominant QRS morphology. The surface ECG pattern reflects anatomical origin and can help to differentiate OT-VAs from the RVOT and LVOT: RVOT-VAs usually have left bundle branch block (LBBB) morphology and inferior QRS axis; conversely, LVOT-VAs can display different morphologies in relation to the position of the arrhythmogenic focus in the LVOT.8
During the past decades, numerous ECG criteria have been proposed to preoperatively differentiate the site of origin of OT-VAs, because the ECG determination of site of origin has important implications for patient counselling and procedure planning. For example, the procedural risk profile and the success rate associated with aortic root ablation in the LVOT are different to those encountered in the RVOT (e.g., risk of stroke or coronary artery damage). Moreover, if LVOT-VA is suspected, retrograde aortic access and coronary angiography should be planned preoperatively.
Unfortunately, the accuracy and reliability of these ECG algorithms are affected by the individual orientation of VOTs relative to the surrounding chest structures, cardiac rotation, chest wall anatomy and lead placement.7 Furthermore, close-proximity anatomical structures produce similar VA morphologies, therefore prediction of the VA site of origin could be challenging. A deep knowledge of the OT anatomy, with a focus on the gross relationship and orientation of OTs in the chest, is of paramount importance in this review of the current ECG criteria for differentiating RVOT and LVOT site of origin.
Anatomy of Ventricular Outflow Tracts: Implications for Diagnosis and Management
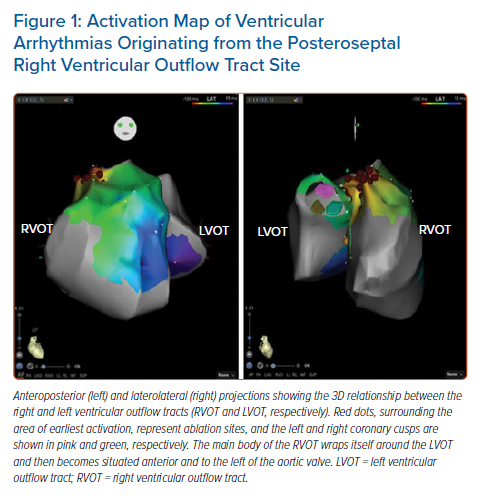
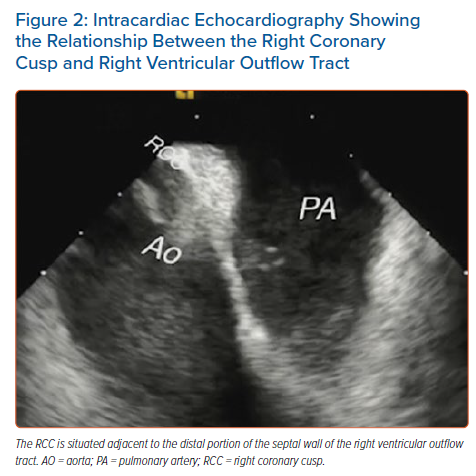
In the area of the OTs, several cardiac structures lie in close proximity: the RVOT and LVOT, aortic root, pulmonary artery and epicardium. From the tricuspid annulus, the RVOT projects in a superior, anterior and leftward direction. The proximal part of the RVOT, near the tricuspid valve, is to the right of the aortic root; the main body of the RVOT wraps itself around the LVOT and is then situated anterior and to the left of the aortic root (Figure 1). The RVOT has two opposing surfaces: an anterior or ‘free wall’ surface and a posterior or ‘septal’ surface. The pulmonary valve is located 1–2 cm superior to the aortic valve and attaches at the sinotubular junction. Because the RVOT and pulmonary valve are positioned more cranially than their LV counterparts, the posterior (septal) wall of the RVOT borders the right coronary cusp (RCC) and a slight portion of the left coronary cusp (LCC; Figure 2). The interleaflet fibrous trigone between the LCC and RCC is directly posterior relative to the RVOT (LCC/RCC commissure).9 Due to this close anatomical relationship, ECG features of VAs from these two regions are nearly identical and may lead to misdiagnosis of the site of origin.
Recently, Liang et al. highlighted the anatomical features of the OT region associated with challenging situations during mapping and ablation of OT-VAs.10 First, the myocardial network in the OT region is complex and results in preferential conduction of the depolarisation wavefront across the interventricular outflow septum, resulting in multiple breakthrough sites from a single arrhythmogenic focus. This is the anatomical substrate responsible for the QRS morphology shift during ablation, requiring mapping and ablation in the adjacent cardiac chamber in 65% of cases. Second, OT-VAs may originate from the LV summit, that is, the more superior, septal and epicardial aspect of the LV. Due to the close proximity of the coronary arteries and the epicardial fat, ablation in the coronary venous system (great cardiac vein or anterior interventricular vein) or a direct epicardial approach may be precluded and an anatomical approach may be required,11 targeting the arrhythmogenic focus from the closest adjacent locations. The close anatomical relationship between the LVOT and RVOT enables suppression of LV summit VA ablation, not only from the LV endocardium or aortic cusp region, but also from the septal aspect of the RVOT.
Current ECG Criteria for Differentiating LVOT from RVOT Origin
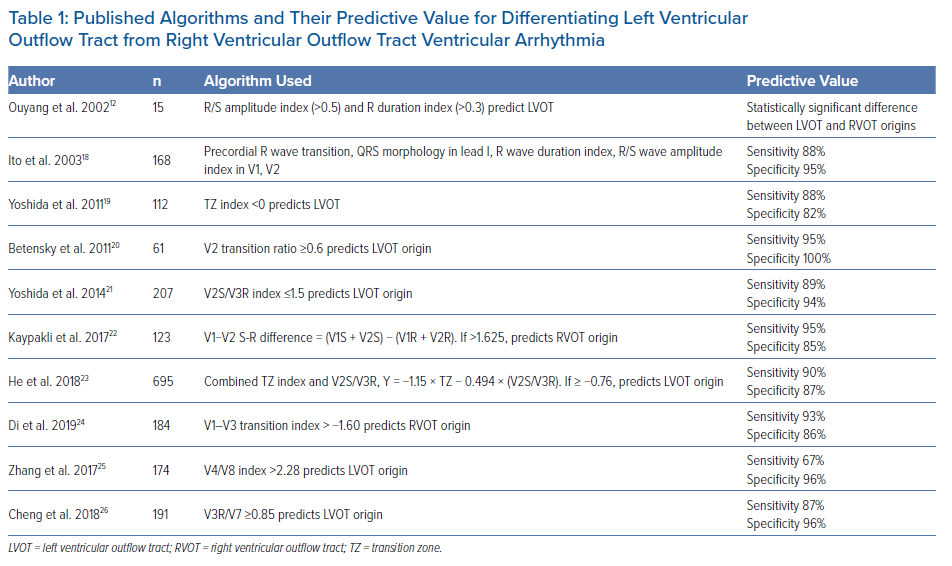
Although VA site of origin is determined using an electroanatomical mapping system during invasive electrophysiological study,7 preoperative analysis of the 12-lead ECG of the spontaneous OT-VAs is commonly used as the basic tool for eliminating unlikely sites of origin and for distinguishing LVOT VAs from RVOT VAs. Moreover, different ECG features have been described to identify discrete OT-VA sources (ASC, AMC, LV summit, RVOT walls) and, despite some limitations, may help in defining the successful ablation site (Figures 3 and 4).4,12–17
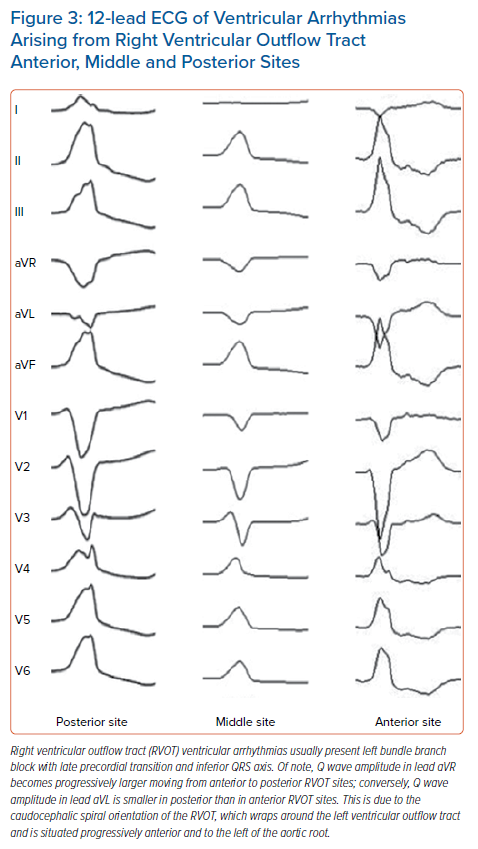
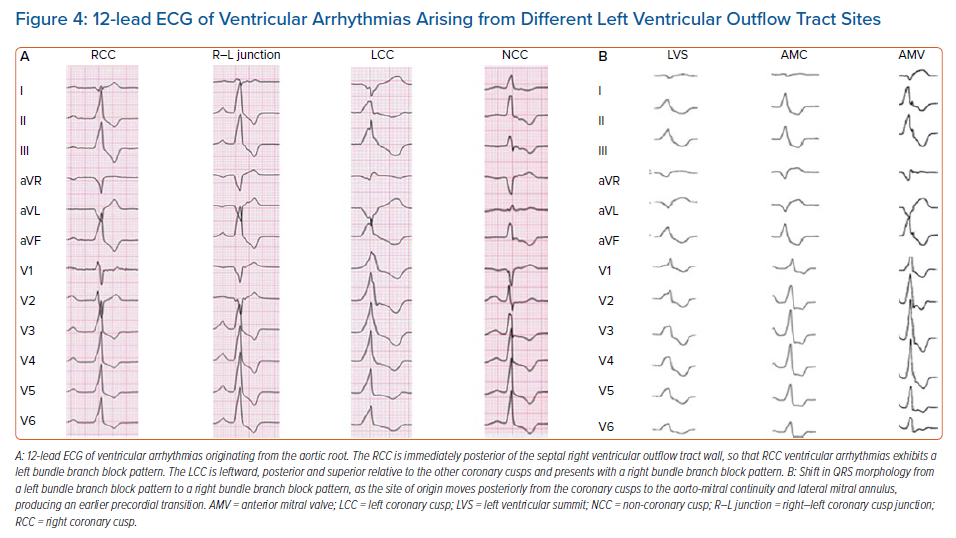
Due to the orientation of depolarising vectors on the horizontal plane axis, anterior structures close to lead V1 will produce an LBBB pattern, while more posterior structures, far from the anterior chest, will produce an RBBB pattern. Therefore, RVOT-VAs will usually be associated with LBBB owing to the anterior position relative to the LVOT (Figure 3). OT-VAs from the LVOT may have RBBB as well as atypical LBBB morphology depending on the position of the site of origin in the LVOT (Figure 4). For example, the RCC is immediately posterior to the septal or posterior RVOT wall, so that RCC VAs have an LBBB pattern (Figure 4A). Moving more posteriorly from the RVOT to the lateral MA produces earlier precordial transition, and the QRS morphology shifts from an LBBB pattern to an RBBB pattern (Figure 4B).5 This is the reason why, in the presence of LBBB and inferior QRS axis, a BBB pattern alone does not enable the distinction between LVOT and RVOT site of origin.
VA with LBBB QRS morphology and inferior axis represents a challenge because distinguishing LVOT from RVOT origin is difficult. Previously, several algorithms have been proposed to correctly diagnose OT-VA origin in these patients.
Ouyang et al. first addressed this issue when they studied 15 patients with VAs with LBBB and inferior QRS axis.12 In eight patients the successful ablation site was the RVOT, and in seven patients it was the ASC. By retrospectively analysing surface ECG, they found that the ASC, due to the posterior and rightward location relative to the RVOT, had a higher and wider R wave in leads V1 and V2 than RVOT VAs, and proposed the indexes of R wave duration and R/S wave amplitude as criteria for differentiating RVOT from LVOT VAs. The R/S wave amplitude ratio in leads V1 and V2 is calculated as a proportion, using the amplitudes of the QRS complex from the peak (R wave) and from the nadir (S wave) to the isoelectric line, and the R/S wave amplitude index is defined as the greater of the R/S wave amplitude ratios in leads V1 and V2; the R wave duration index is measured by dividing the longer of the R wave durations in leads V1 and V2 by the QRS complex duration. An R/S amplitude index <0.3 and R wave duration index <0.5 suggest an RVOT VA.
By correlating the ECG findings with the catheter ablation site in 80 patients with OT-VAs, Ito et al. proposed an ECG algorithm to identify the discrete origin of IOT-VAs.18 Four indices were used in the stepwise algorithm for differentiating RVOT and LVOT site of origin: the precordial R wave transition, QRS morphology in lead I, the R/S wave amplitude index in leads V1 or V2 and the R wave duration index. This algorithm was further evaluated in a prospective cohort of 88 patients with an overall sensitivity of 88% and specificity of 95%. No patients with right-sided VAs were misclassified as having left-sided VAs, whereas two patients with LVOT-VAs were misdiagnosed as having RVOT-VAs. Although prospectively tested with considerable results in term of sensitivity and specificity, this algorithm may appear cumbersome to use, due to the complex stepwise design and its reliance on QRS morphology in lead I. Indeed, QRS morphology may be affected by factors such as variation in positional relationship of OT and chest wall, body habitus, ventricular hypertrophy, chest wall deformities and chronic obstructive pulmonary disease (COPD).
The seminal finding that LVOT VAs, due to the posterior position of the site of origin relative to RVOT VAs, result in a mean depolarisation vector directed towards V1 and V2, led to the development of new algorithms based on the site of the R wave transition in the precordial leads.
Yoshida et al. developed the transition zone (TZ) index, in the assessment of surface ECGs of OT-VAs with LBBB morphology and inferior axis in 112 patients who had successful ablation in the RVOT (n=87) and ASC (n=25).19 The TZ was defined as the precordial lead in which the R wave and S wave have equal amplitudes, and the lead number is used as the score. The chest leads involved in the score are those with an R/S wave amplitude ratio between 0.9 and 1.1. The TZ index is calculated as the TZ score in OT-VA minus the TZ score in sinus rhythm (SR). Relative to a normal TZ of lead V3–V4 in SR, Yoshida et al. reported in their case series that approximately 35% of patients had a shift of the precordial TZ in SR, defined as counterclockwise rotation (CCWR) if TZ score in SR was <V3 and clockwise rotation (CWR) if TZ score in SR was >V4. That study showed that the site of TZ of OT-VAs is affected by cardiac rotation and that both RVOT VAs and LVOT VAs have a lower TZ score in CCWR than in CWR. Meanwhile, the TZ during SR is affected by the cardiac rotation too. Hence, Yoshida et al. compared TZ score during OT-VAs and SR to obtain a novel cardiac rotation-corrected index. A TZ index cut-off <0 predicted an ASC origin with 88% sensitivity and 82% specificity.
In the study by Betensky et al., precordial transition, defined as the single precordial lead in which the R wave amplitude exceeds the S wave amplitude, was used to distinguish VA origin:20 a precordial transition later than lead V4 or later than SR transition indicated an RVOT origin (LVOT origin excluded with 100% accuracy), while a precordial transition in lead V3 or earlier than SR could not rule out an RVOT origin.11 In the latter case a new criterion, the V2 transition ratio, was evaluated to differentiate RVOT from LVOT origin. It was derived in a retrospective ECG analysis of 40 OT-VAs that were successfully ablated, and was calculated by dividing the percentage R wave during VT, (R/[R + S])VT, by the percentage R wave in SR, (R/[R + S])SR.20 In 21 prospective cases, a V2 transition ratio >0.6 predicted an LVOT origin (sensitivity, 95%; specificity, 100%; accuracy, 91%), whereas a V2 transition ratio <0.6 predicted an RVOT origin.
Similarly, Yoshida et al. studied OT-VAs with an LBBB pattern and inferior QRS axis morphology in 207 patients who underwent successful catheter ablation in the RVOT (n=154 patients) and LVOT (n=53).21 They proposed the V2S/V3R index, calculated from the S wave amplitude in lead V2 divided by the R wave amplitude in lead V3 during the OT-VA, to reliably differentiate between RVOT and LVOT VA origin. A V2S/V3R index ≥1.5 predicted an RVOT site of origin; in contrast, a V2S/V3R index ≤1.5 indicated an LVOT site of origin with a specificity of 94% and sensibility of 89%. The rationale for this index lies in the direct anatomical relationship between RVOT, LVOT and the lead V3 position, which is close to the RVOT and records a smaller R wave in RVOT-VAs.21
Kaypakli et al. proposed the S-R difference in leads V1 and V2 (V1–2 SRd), calculated using this formula on the 12-lead surface ECG: (V1S amplitude + V2S amplitude) – (V1R amplitude + V2R amplitude).22 Owing to its anterior position, the RVOT is closer to leads V1 and V2 than the LVOT, and therefore RVOT VAs will produce a deeper S wave and smaller R wave in these leads; conversely, the LVOT is further from leads V1 and V2 relative to the RVOT, and therefore LVOT VAs will give rise to a higher R wave and smaller S wave in these leads. Thus, V1-2 SRd is lower in LVOT sites of origin than in RVOT sites of origin, and the cut-off proposed by Kaypakli et al. is 1.625 mV (sensitivity, 95.1%; specificity, 85.5%).
He et al. studied a cohort of 488 patients with idiopathic PVCs or VT with LBBB and inferior QRS axis.23 They developed an ECG diagnostic model consisting of two ECG algorithms, the TZ index and V2S/V3R index, with a cut-off ≥−0.76 predicting an LVOT site of origin. This model was prospectively validated in a cohort of 207 patients and yielded a sensitivity of 90% and a specificity of 87%.
Di et al. developed the V1–V3 transition index for differentiating RVOT and LVOT VAs with precordial transition in lead V3.24 This novel electrocardiographic criterion was derived from an analysis of 147 consecutive patients successfully ablated in RVOT (n=118) or LVOT (n=29), and was defined as the sum of the S wave in leads V1 and V2 during PVC divided by the S wave amplitude in the same leads during SR, minus the sum of R wave amplitude in leads V1, V2, V3 during PVC divided by the R wave amplitude in the same leads during SR; that is, [(SPVC/SSR)V1 + (SPVC/SSR)V2] − [(RPVC/RSR)V1 + (RPVC/RSR)V2 + (RPVC/RSR)V3]. RVOT sites of origin had significantly larger V1–V3 index values than LVOT sites. A cut-off > −1.60 predicted an RVOT origin with 93% sensitivity and 86% specificity, and on receiver operating characteristic (ROC) analysis it had an area under the curve (AUC) of 0.931. In the validation cohort of 37 patients, V1–V3 index had 95% accuracy in predicting an RVOT origin. However, the algorithm was developed from a population in whom only a minority of VAs came from the LVOT (19.7%); therefore, the accuracy of the algorithm by Di et al.24 should be confirmed in a population with a larger series of LVOT-VAs. Moreover, the algorithm was tested only for OT-VAs with precordial transition in lead V3, thus its utility in clinical daily practice is limited to this subgroup of OT-VAs.
More recently, the diagnostic value of the ECG posterior and right leads has been evaluated in OT-VAs. Zhang et al. studied the usefulness of the modification of lead V5 to V8 (at the inferior point of the scapula) in 134 patients undergoing ablation of PVCs.25 They found that PVCs successfully ablated from the left side had a statistically significantly higher V4/V8 R wave ratio compared with right-sided PVCs. When normalised to SR by dividing the OT-VA V4/V8 ratio by SR V4/V8, PVCs successfully ablated from the left side had a statistically significantly higher V4/V8 index compared with right-sided PVCs. They validated this new criterion in a prospective validation cohort of 40 patients. V4/V8 R wave ratio >3 had a sensitivity of 75%, specificity of 82%, negative predictive value (NPV) of 89% and positive predictive value (PPV) of 64% for left-sided locations. A cut-off >2.28 for V4/V8 index had a sensitivity of 67%, specificity of 96%, PPV of 89%, and NPV of 87% for left-sided origins. Normalising the V4/V8 ratio to the patient’s SR resulted in improved specificity (100%) and PPV (100%) for PVCs with a V3 precordial transition (n=19 patients) compared with VAs with precordial transition other than lead V3.
Finally, Cheng et al. developed a new criterion for differentiating LVOT from RVOT VAs, by replacing leads V5 and V6 with leads V3R and V7.26 Lead V3R was placed at the corresponding right-hand side to lead V3, and V7 was placed at the left posterior axillary line of the fifth intercostal space. In the analysis of OT-VA morphologies successfully ablated in 97 consecutive patients (74 with RVOT origin and 23 with LVOT origin), R wave amplitudes in lead V3R and S wave amplitudes in lead V7 were significantly larger for LVOT origin than RVOT origin. Furthermore, the QS pattern in lead V3R was found only in patients with RVOT sites of origin, and the S wave in lead V7 was detected only in patients with LVOT sites of origin. This led to the development of the V3R/V7 index, calculated as the ratio of R wave amplitudes in leads V3R and V7 during VA. V3R/V7 index ≥0.85 predicted an LVOT origin with 87% sensitivity and 96% specificity in the development cohort. In the validation cohort, consisting of 74 patients successfully ablated from RVOT and 20 patients from LVOT, the V3R/V7 index correctly predicted the successful ablation site in 94.7%. Published algorithms and their predictive value in differentiating RVOT and LVOT VAs are listed in Table 1.
Current ECG Criteria: Relevance to Anatomy
The ECG features of OT-VAs rely strongly on the position of the LVOT and RVOT relative to the exploratory leads. The RVOT is to the right of the aortic root and, due to the close anatomical relationship with leads V1–V3, RVOT sites of origin result in lower R-wave amplitude in these precordial leads and delayed precordial transition compared with LVOT. This finding is crucial for the understanding of the ECG criteria based on R and S wave amplitudes in the precordial leads and in the OT-VA precordial transition lead, such as the indexes of R wave duration and R/S wave amplitude by Ouyang et al., the TZ index and V2S/V3R index by Yoshida et al., the ECG prediction model by He et al., the V2 transition ratio by Betensky et al. and the V1–V3 transition index by Di et al.12, 19,2021,2324
These criteria, although based on electroanatomical considerations, have various limitations that can possibly lead to misdiagnosis. First, QRS morphology in leads V1–V3 reflects the cardiac anatomical orientation in the horizontal plane, resulting from the depolarising vector moving towards or away from the anterior chest wall. Due to the close relationship between the RVOT and LVOT, and between the OTs and the anterior chest wall, the anterior leads might not always show a significant difference between RVOT and LVOT in the relative S and R wave amplitudes on vector analysis, especially in the presence of COPD or pericardial effusion. Second, although the proximal part of the RVOT is to the right of the aortic root, as the RVOT rotates and wraps around the central aorta, the infravalvular portion of the RVOT becomes located to the left of the aortic root. Therefore, misdiagnosis can be due to the underestimation of the complex 3D anatomical relationship between OTs when analysed only in the horizontal plane. Third, the precordial transition lead depends on the cardiac electrical axis in the horizontal plane. The electrical axis of the heart is strongly related to the cardiac anatomic orientation in the chest, which varies greatly between individuals. As a result, the precordial transition lead varies with cardiac anatomic orientation in each patient. Yoshida et al. reported that approximately 35% of patients have a shift of the TZ in SR, and consequently during OT-VAs, due to cardiac electrical axis rotation in the horizontal plane.19 This variability influences the QRS morphology in the anterior leads and in the precordial transition zone, and accounts for the misleading identification of the OT-VA site of origin when ECG criteria are used solely with regard to the horizontal axis of the heart.
As a result, horizontal plane analysis has limited accuracy and reliability in differentiating left from right OT. This concept was first demonstrated by Tanner et al., who showed that both RVOT origin and LVOT origins (ASCs, coronary sinus, epicardium) could display a similar precordial transition in lead V3 and QRS morphology in the horizontal plane due to the close anatomic relationships between OTs.27 To address the ECG criteria pitfalls related to the variability of cardiac anatomic orientation, body habitus and chest features, Betensky et al. compared the VA with SR QRS morphology, and normalised the VA ECG features of each patient with respect to the SR.20 Their V2 transition ratio outperforms traditional criteria and is the only index to be prospectively validated.
In consideration of the limitation of horizontal axis analysis, in recent years the OT-VAs have been studied on the sagittal axis, through the use of right precordial and posterior leads. As noted here, the complex anatomic relationship between OTs cannot be defined only in terms of right and left structures because the RVOT rotates, becoming situated anterior and to the left of the LVOT. Due to the anteroposterior intertwining of the anatomic relationship between OTs, OT-VAs moving away from the LVOT are expected to produce taller R waves in the anterior leads and deeper S waves in the posterior leads, compared with RVOT-VAs.
Zhang et al. first addressed this issue and proposed the V4/V8 ratio, with the modification of lead V5 to V8.25 Increasing values of mean V4/V8 ratio were reported as the VA site of origin moved from anterior to posterior, due to the electrical propagation along the posteroanterior axis. Normalisation of the V4/V8 ratio with the V4/V8 ratio in SR, produced the V4/V8 index, which had increased NPV, PPV and specificity relative to V4/V8 ratio for left-sided OT-VAs. Moreover, in a subgroup of patients in the prospective validation cohort with V3 precordial transition, the V4/V8 index had 100% specificity and PPV. Overall, the anteroposterior ratio, V4/V8, outperformed previously reported criteria with a demonstrated diagnostic accuracy >90%.
Cheng et al. noted similar results for the V3R/V7 index, which had a higher accuracy, as measured using AUC on ROC analysis (0.954), than that of previously reported criteria, including V2S/V3R (0.896; p=0.353), V2 transition ratio (0.792; p=0.035) and TZ index (0.666; p=0.001).26 In the validation cohort, the V3R/V7 index was able to correctly predict the site of successful ablation in 94.7%, and a cut-off ≥0.85 ruled out an RVOT origin with 98.6% accuracy. Additionally, the V3R/V7 index had 97% specificity and NPV for patients with R/S transition in lead V3, and 100% specificity and PPV for patients with cardiac rotation. Although a direct comparison between these two indexes has not been conducted, the V4/V8 index and V3R/V7 index have similar diagnostic accuracy, although the V3R/V7 index is not normalised to SR. This lack of difference between the two indexes is hypothesis generating, and may be related to the parallel orientation of the axis formed by the V3R and V7 leads through the chest with the axis of electrical propagation between the RVOT (anterior and rightward) and LVOT (posterior and leftward). Being more in line with the electrical depolarising vector, these leads may record a higher wave amplitude and more significant differences.
Overall, the study of the relative amplitudes of the electrical cardiac vector moving in an anteroposterior dimension is supported by anatomical reasons. Anteroposterior ECG configurations maximise the differences in vector ratios and provide added diagnostic value and predictive accuracy for differentiating LVOT from RVOT VAs, regardless of cardiac rotation and R/S transition lead, because the sagittal plane analysis is less affected by these variables. However, as reported in recent reviews, algorithm accuracy is limited, and it is preferable to use a combined model consisting of different algorithms, to account for the limitations of each individual ECG-based criterion.28–30
Beyond 12-Lead ECG: Non-invasive ECG Mapping
The diagnostic accuracy of current ECG algorithms in distinguishing RVOT from LVOT VAs is affected by several factors, such as body habitus, heart orientation in the chest and variability in precordial lead placement. Moreover, 12-lead ECGs cannot provide information on the activation sequence during VAs. To overcome these limitations, non-invasive ECG mapping (NIECM) systems have been proposed, which have shown promising results. With a vest embedded with 252 electrodes at torso level, the patient undergoes thoracic CT to obtain heart–torso anatomic data, and data on the anatomic relationship between electrodes on the vest, and the heart. Subsequently, the NIECM system reconstructs the unipolar electrograms recorded by each electrode and merges body surface electrical data with the anatomical CT heart–torso images, providing 3D colour-coded, isopotential, voltage and activation maps.31 Jamil-Copley et al. prospectively assessed the accuracy of NIECM in peri-procedurally predicting OT-VA site of origin in 24 patients, and compared NIECM performance with that of three published ECG algorithms.32 NIECM successfully identified OT-VA site of origin in 23/24 patients (96%), outperforming the former published algorithms, which had an accuracy of 50–88%. Similar NIECM accuracy has been reported by Erkapic et al., who noted an advantage in terms of radiofrequency energy applications and time to ablation compared with conventional 12-lead ECG-guided mapping and ablation.33
Recently, Mountantonakis et al. tested the accuracy of NIECM in distinguishing IOT-VAs arising from the septal RVOT, ASC region and LV summit in a cohort of 31 consecutive patients.34 The non-invasive electroanatomic mapping analysis showed that all three origins had close breakthrough sites, resulting in similar QRS morphology in 12-lead ECGs, which accounts for the frequent misdiagnosis of IOT-VAs coming from this anatomically complex region. Conversely, based on the electrical propagation pattern and the activation timing of the basal lateral MA and superior basal septum, NIECM had 100% accuracy in correctly identifying the three sites of origin. Although future studies are needed to confirm these results, NIECM appears to be a promising tool for prognostication and planning of mapping and ablation of IOT-VAs.
Limitations
Of note, the currently used criteria have several limitations. First, these criteria were developed using small cohorts, and only the V2 transition ratio, the V4/V8 index and the V3R/V7 index have been prospectively tested. Hence, these criteria should be further validated in larger populations. Second, inter-individual variability in lead placement could have affected the development of the criteria.35 Finally, in all the studies, the successful ablation site determined the location of the arrhythmogenic focus. The site of successful ablation, however, may not represent the real focus but may represent only the breakthrough site, and preferential conduction across the ventricular outflow septum can affect the predictive accuracy of algorithms.36 Indeed, some patients with VAs originating from the ASCs have shared myocardial connections bridging LVOT and RVOT with early breakout at RVOT, thus affecting the accuracy of ECG predictive algorithms in the OTs. Moreover, due to the close relationship of the anatomical structures in the OTs, the same arrhythmia can be successfully ablated from different sites, particularly the arrhythmias from the LV summit and from the posterior RVOT-RCC.37
Conclusion
Idiopathic OT-VAs represent an intriguing clinical challenge due to the many ECG features resulting from heterogeneous sites of origin. Predicting an RVOT origin rather than an LVOT site of origin is of pivotal importance in improving patient counselling and procedure planning, and in reducing unnecessary arterial or venous access, radiation exposure, ablation duration and risk of complications. Several morphological, electrophysiological and individual factors hamper the accuracy of ECG in predicting VA site of origin, and have led to the development of a multitude of ECG-based algorithms and new promising non-invasive electroanatomic mapping systems.
Nonetheless, the interpretation of 12-lead ECG morphology of VA using an anatomically based approach and alternative ECG configurations may be a useful tool for differentiating LVOT from RVOT VAs, and improving the safety of radiofrequency catheter ablation procedures.
Clinical Perspective
- Ventricular outflow tracts are the most common sites of origin of idiopathic ventricular arrhythmias.
- Ventricular outflow tract arrhythmias have focal origin and display a single dominant QRS morphology. The distinction between right and left outflow tract origin carries important clinical and prognostic implications.
- Although several ECG criteria have been developed to distinguish right from left outflow tract origin, their accuracy and reliability are affected by individual orientation of ventricular outflow tracts relative to the surrounding chest structures, cardiac rotation, chest wall anatomy and leads placement.
- This review of currently used ECG algorithms to differentiate the site of origin of ventricular arrhythmias is useful to clarify the advantages and disadvantages of each algorithm and to assist electrophysiologists in daily clinical practice.