


Catheter ablation of ventricular tachycardia (VT) has for many years used the 12-lead ECG as an adjunct to contact mapping to localise the site of origin (SoO) of the arrhythmia. Its widespread use is due to the majority of induced VTs not being haemodynamically tolerated during ablation procedures.1 However, the resolution it offers in delineating the SoO is limited and cannot be used to solely guide ablation. Contact mapping offers accurate localisation and delineation of arrhythmia mechanisms, but is limited by the time taken to collect and process electrograms.2 This has resulted in various ECG algorithms designed to improve the resolution of the ECG and help electrophysiologists localise the SoO.3–5 Despite these attempts, the technology is limited as body surface measurements reflect activation from the whole heart and attempts to localise the exit site of re-entrant circuits in the heart are confounded.6 Furthermore, in interpreting the ECG, correction is not made for the anatomical orientation of the heart within the thorax. This position and orientation is wide ranging in patients with structurally abnormal hearts.7 Therefore in this context it can be used as an adjunct but not as the sole guide to ablation.5
Electrocardiographic imaging (ECGI) is an imaging modality developed to address the shortcomings of existing technology, in particular the 12-lead ECG. Body surface unipolar electrograms are used to calculate and display electrograms on a digitised model of the epicardial surface of the heart.6 With reconstruction of the ventricular activation and repolarisation sequences in various cardiac rhythms, it is possible to use a single beat.8 Expedient mapping of ventricular arrhythmia is feasible, as is the capability to non-invasively guide therapy and produce personalised models of cardiac electrical activation.
A solution to the inverse problem of electrocardiography is needed if this is to be achieved. The inverse solution is a mathematical formula that predicts the electrical source based on the recorded electrical signals some distance from it. In the case of body surface mapping used in ECGI, the epicardial activation is the former and the electrical cardiac recordings from the skin the latter. The accuracy of this calculation depends on having a complete recording of the ECG on the skin surface by using multiple electrodes over the whole torso, accurate measurements of the distances from the recording site to the source using imaging, such as CT, which allows such a calculation, and a uniform or at least predictable medium between the two. This final factor is the greatest weakness of body surface mapping because although standardised models of the tissues in the thorax can be built, there is clearly a big individual variation in fat, muscle and lung distribution between the heart and the skin which adds error to the inverse solution calculation.9
There are a variety of systems that use body surface mapping to map ventricular activation and in this review the term ECGI is used as an umbrella term for technologies that are in principle using similar mathematical constructs to produce ventricular maps.
Electrocardiographic Imaging – Initial Validation
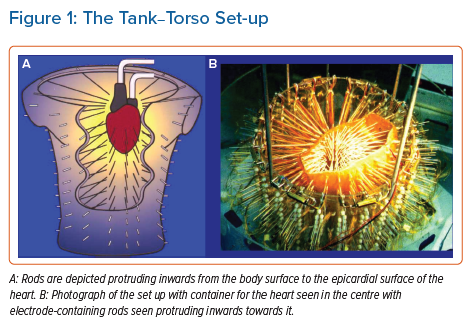
Research and development of the technology has been conducted using mainly canine and porcine hearts. The most prominent research was performed by the Rudy research group in the US. Their work resulted in the creation of the most readily available commercial system (CardioInsight™, Medtronic). Reconstruction of ventricular activation using a tank-torso model has been shown to be accurate and capable of differentiating between endocardial and epicardial activation (Figure 1).10,11 Further studies demonstrated the capacity to detect scar and re-entrant circuits.12,13 More contemporary research using the tank torso showed a correlation of 0.68 between actual and reconstructed electrograms during sinus rhythm, right bundle branch block (RBBB) and pacing from different sites. Endocardial sites of activation were elucidated with an accuracy of 9.1 ±0.6 mm. Importantly, this study highlighted blocking artefacts which appear as lines on ECGI maps.14
The tank-torso studies were proceeded by assessment in the ex vivo setting. Using epicardial sock electrodes in the open chest of a dog, good correlation was found between measured and reconstructed electrograms during VT.15 Components of re-entrant VT circuits could be seen, including lines of block. Good correlation was also found in a recent study with a similar set up, with a correlation for activation time of 0.82. Additionally, this study showed that the use of a spatiotemporal algorithm to calculate the earliest site of activation had the potential to improve accuracy.16 Other algorithms have been used to improve the resolution of ECGI with varied results.17
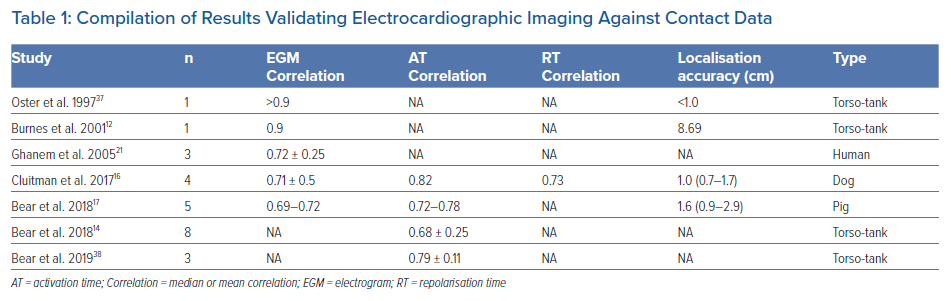
A full commentary on the development of the technology is beyond the scope of this review and the most relevant studies are summarised in Table 1.
Electrocardiographic Imaging Clinical Set-up in Humans
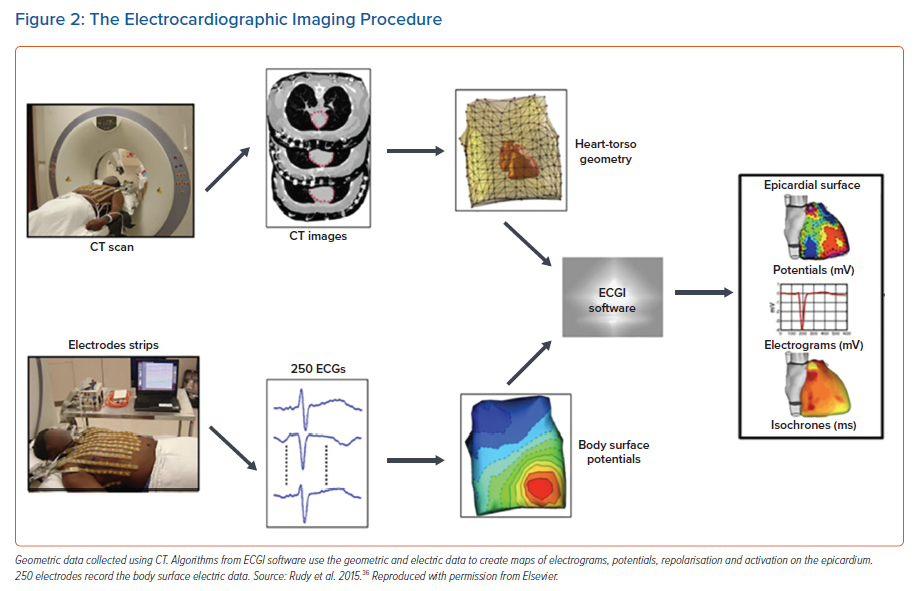
The workflow for the system is illustrated in Figure 2. Most commonly, a vest consisting of multiple electrodes is attached to the patient’s torso before an imaging scan. This scan can be a cardiac MRI or more frequently a CT scan. In the case of the commercially available system (CardioInsight™, Medtronic) a CT scan is the preferred modality. This is used to create 3D geometry of the heart’s epicardial surface and to localise the body surface electrodes on the torso. Each of these electrodes is radio-opaque and therefore visible, allowing their geometric position in relation to the epicardial surface to be calculated. This data is then used to display reconstructed electrograms using the inverse method.18 One beat of a cardiac rhythm is necessary to produce an activation map on the geometry. This capability is of particular interest in the arena of VT ablation given the lack of haemodynamic tolerance in most cases.19
Electrocardiographic Imaging Mapping of Ventricular Activation
The first human application of ECGI was a qualitative study in four subjects, assessing sinus rhythm, right bundle branch block (RBBB) and right/left ventricle (RV/LV) pacing. In sinus rhythm, epicardial breakthrough occurred at the RV free wall. Breakthrough in the antero-septal LV consistent with the left anterior fascicle activation was also seen. This activation pattern contrasted to RBBB which was predictably delayed in the RV, with similar LV activation via the left anterior fascicle, as seen in the normal control. Pacing was performed from the RV and LV with earliest activation on ECGI located to within 7–11 mm. The authors also studied repolarisation, finding as expected that repolarisation was static and unaffected by activation time in areas of normal conduction.8 These findings were backed up by another study assessing activation and repolarisation under physiological conditions. Volunteers with normal hearts were studied and the earliest epicardial breakthrough was at the RV apex as expected. Repolarisation was again determined by local properties and independent of activation.20
Ghanem et al. studied the accuracy of ECGI in localising areas of early activation during ventricular pacing using an electrode sock placed on the epicardial surface of the heart during cardiac surgery as a comparator. Pacing sites were <10 mm away from the ECGI predicted site.21 This pacing data can be compared to another study, exclusively assessing accuracy regarding pacing sites. Accuracy for RV pacing was 7.7 mm and 7.9 mm for LV pacing. The patients all had pacemakers implanted and distances from LV and RV pacing sites to earliest activation on ECGI where analysed.22 Electrograms reconstructed during sinus rhythm in the Ghanem et al. study showed good correlation – mean cross correlation (CC) was 0.89 for RV and 0.67 for LV. Similarly, the T-wave morphology was faithfully reconstructed with CC 0.77 for the LV with worse accuracy for the RV at 0.55. This discrepancy was postulated to be on account of different filling pressures in the RV, which alludes to one of the main confounding factors for this study and those that have succeeded it. Epicardial sock data and ECGI data were collected at different times. This non-simultaneous data collection has the potential to add significant error. For ECGI’s purported ability to map VT, low amplitude details on the electrograms are seen to be lost on the reconstruction in ECGI, meaning there is likely to be insufficient resolution to map diastolic pathways during VT.21
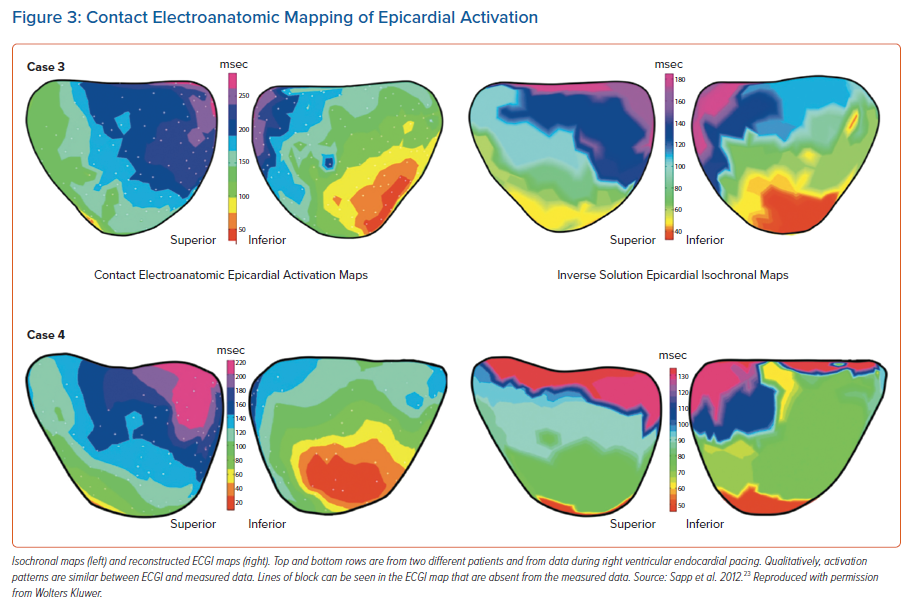
Sapp et al. performed the first validation of ECGI using a contact mapping system to collect data from the epicardial surface using a 120-lead system. Data was collected from VT ablation procedures requiring epicardial access. They showed that the location of epicardial pacing sites was heavily influenced by scarring. Pacing from areas of scar reduced accuracy to 43 mm from a mean for all sites of 13.6 mm. Repolarisation was not assessed but activation time was reconstructed with no quantitative analysis. Activation maps were qualitatively similar, but showed variation including abrupt changes in activation times giving the appearance of lines of block and rapid activation over large areas of myocardium (Figure 3).23 These latter two features have been seen in other studies and have important implications for ECGI’s use in ventricular arrhythmia.8,21,20 Large areas activating simultaneously would affect the accuracy of using the system to locate exit sites for VT. Blocking could falsely allocate areas as zones of slow conduction, hindering the capability to risk stratify patients for arrhythmia or locate VT circuits.
A quantitative comparison of ECGI and contact mapping was provided by Duchateau et al. whose large study of 55 patients demonstrated poor correlation (CC = 0.03) between invasive and non-invasive mapping. Wide inter-patient variability (-0.68–0.82) was found suggesting significant heterogeneity and agreement between maps was poorest in areas of scarred myocardium. As mentioned above, artificial lines of block were present in the majority of ECGI maps providing further evidence of potential limitations to the system’s clinical usefulness.24
A more recent study, again employing quantitative analysis to compare ECGI to ground truth data collected using contact mapping on the epicardium, found more favourable results. Eight patients were studied with geometries aligned using fiducial anatomical points. The correlation between ground truth contact mapping data and ECGI was 0.71 for the morphology of the unipolar electrograms and 0.66 for activation times. Results were similar to those in earlier studies for localisation of epicardial pacing sites with an accuracy of 13.2 mm. This value was negatively affected when pacing was from within scar, which was purported to be due to far field capture or activation of surviving myocardial bundles within the scar.25
The large differences in correlation between the findings of these similar studies is difficult to fully account for. The Duchateau et al. study collected contact mapping in a non-simultaneous manner which although it could confound the results, is unlikely to solely account for the heterogeneity. There is evidence that small variations in the alignment of cardiac geometries from two different systems, which is necessary for quantitative comparison, can lead to large variations in correlation. Additionally, most of the data was collected in sinus rhythm thereby using the heart’s intrinsic conduction system and reducing total time for ventricular activation. With ECGI having been shown to be more reliable with a slower ventricular conduction, this could also have contributed to the findings.25
Electrocardiographic Imaging Mapping of Ventricular Arrhythmia
The mapping of VT with contact electroanatomic mapping (EAM) involves invasive procedures associated with a high risk of complications and long procedures. As we know, it is the potential for expedient localisation of VT that makes ECGI a potentially efficacious clinical tool. VT results in a large electrical signal, has a high signal-to-noise ratio and has reduced involvement of the conduction system. Despite this, initial validation of the system suggests that it does not possess sufficient resolution to solely guide ablation.
The first application of ECGI in humans assessing its reliability in localising VT was performed in a patient with a structurally normal heart. Earliest activation was tracked to the LV apex on both ECG and EAM.26 Another study assessed purely outflow tract (left and right) ventricular arrhythmias and compared ECGI to conventional 12-lead ECG in 24 patients. Localisation using ECGI was superior with correct localisation of arrhythmia in 96% of patients and the ability to discern between septal and free-wall origin in 100%, and 12-lead performance was significantly worse with 50–88% and 37–58%, respectively.27 These results are perhaps unsurprising given known limitations, with pace mapping leading to errors of up to 2 cm in localisation.28
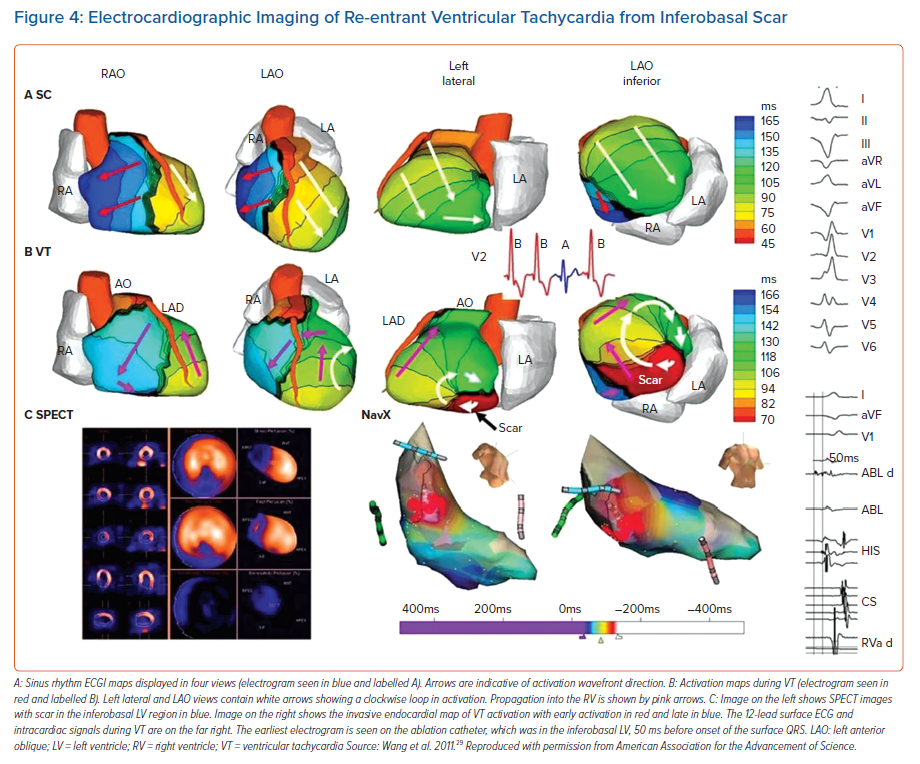
Wang et al. studied 25 patients undergoing mapping of VT, with four patients having ECGI performed intraoperatively.29 The remainder had ECGI performed preoperatively. VTs were localised using contact activation mapping strategies, which were subsequently compared to those of ECGI (Figure 4). The majority of the VTs mapped were found to be focal, with ECGI localising arrhythmia to the correct ventricle in all cases. No quantitative analysis was performed examining location accuracy, but sites of earliest origin on ECGI were qualitatively similar to those of the contact maps. RV sites were correctly reconstructed in 10 out of 11 locations and in the LV in 11 of 12. Discrepancy in these cases was purported to be due to a prior accessory pathway ablation in the right-sided case and due to a large LV aneurysm in the left. The latter circuit was said to have had multiple potential exit sites. Five patients had epicardial exit sites for VT and a pure Q wave was seen on ECGI. For the remainder (excluding RV outflow tract because of its thin wall) 88% had an rS morphology, denoting a mid-myocardial or endocardial origin.
While this work is important in analysing ECGI’s potential for use in ventricular arrhythmia, it is subject to several limitations. VT was induced and recorded outside of the setting of VT ablation resulting in non-simultaneous data collection adding an array of confounding variables. Furthermore, as discussed earlier, the most reliable means of localising a VT site of origin is with entrainment which was not performed in this study. There was also no mention of measures taken to ensure the VTs recorded preoperatively corresponded to those mapped during ablation procedures. This could have been achieved using a simple 12-lead ECG but was not explicitly stated in the study’s methodology.
A more recent study assessed a body surface ECGI system in four patients during VT ablation. ECGI was seen to faithfully recreate the activation sequences of VT when compared to contact mapping data.23 Although this study addressed the limitations posed from non-simultaneous recordings, no quantitative assessment of sites of earliest activation were performed. This was due to a lack of data points from activation mapping and entrainment. A subsequent study which used an inverse method to reconstruct electrograms on the epicardial and endocardial surfaces showed that mapping during VT was qualitatively accurate, but no quantitative comparisons were made.30
A quantitative analysis of the accuracy in mapping VT was performed by Graham et al. VT SoO was localised using validated techniques such as entrainment and pacemapping during catheter ablation procedures. Haemodynamically stable VT was mapped using entrainment or areas where ablation terminated the rhythm. Unstable VT was mapped using pacemapping. These regions were then marked on the EAM for comparison with ECGI areas of earliest activation. Distances between the SoO of VT and the earliest sites of activation on ECGI was 22.6 mm. Comparison was also made between ECGI and standard 12 lead, using a validated method for allocating SoO based on 12-lead results which showed ECGI to be significantly more accurate (p<0.05).31 The results of this study, while offering the best available quantitative data on ECGI resolution during VT in humans, is subject to potential errors including far field capture during pacemapping, exit sites being remote from the point of entrainment and error introduced with alignment of geometries.
This latter study demonstrates that the resolution of the system is inadequate to be the sole guide for ablation. The significantly increased resolution offered when compared to the 12-lead ECG is promising, but data demonstrating its clinical efficacy would be needed before the system was put into wider use. Given that VT clinical outcome studies are notoriously difficult to conduct, this may not be forthcoming.
Clinical Outcome Studies
In a prospective randomised controlled trial of premature ventricular contractions (PVC) ablation, conventional ablation using a 12-lead ECG was compared to an ECGI-guided approach in 21 patients. Clinical parameters for assessment included time to ablation, acute success (termination of PVCs), 3-month success, fluoroscopy time and procedure time. ECGI resulted in more accurate localisation of arrhythmia with 95.2% of arrhythmias correctly located. The 12-lead ECG predicted the correct chamber in 76.2% of cases and identified arrhythmia origin in 38.1%. The time-to-ablation metric was reduced in the ECGI arm but the fluoroscopy times were significantly higher. No difference was seen in outcome at 3 months.32 The increased accuracy of ECGI could result in fewer vascular complications by avoiding unnecessary transeptal puncture as well as improving clinical workflows. However, lack of effect on clinical outcome data could hinder widespread use of the system.
Regarding the mapping of PVCs the capacity of the system to map the entire ventricular activation sequence using one beat of arrhythmia could be used to target infrequent PVCs that are difficult to map in the electrophyiology lab. The body surface electrodes could be worn before a procedure, enabling mapping to be conducted on the ward or even provoked during exercise. This could be of particular use in VF that is triggered ectopically and the system may offer useful insight into the substrate of VF itself. It has been demonstrated that ECGI drivers found during the mapping of VF co-localised to abnormal areas of depolarisation denoted by contact mapping. The targeting of these areas with ablation was an effective treatment for patients with recurrent VF.33
The use of ECGI in the clinical context has been extended to its use as an adjunct to non-invasive ablation of VT. VT was targeted non-invasively using single-fraction stereotactic body radiation therapy (SBRT) delivering 25 Gy to the area targeted. Areas were chosen based on non-invasive imaging of anatomy including ECGI. Using this novel technique on five patients, VT burden at 3 months was found to be reduced by 99.9%.34 This study was followed by the prospective Encore VT trial enrolling 19 patients (17 for VT, two for PVC). The median number of VT episodes reduced from 119 to three (p<0.001). Shocks from an implantable cardioverter defibrillator and anti-tachycardia pacing decreased along with a 94% reduction in VT episodes or PVC burden. Survival at 6 months was 89% and 72% at 12 months. There was a significant decrease in the use of antiarrhythmic agents.35 Caution does need to be exercised in interpreting these results. At 90 days, 10.5% of patients had developed a serious adverse event related to the procedure. The study demonstrates the potential benefit that using ECGI could have for patient outcomes. However, data beyond that collected from a single centre is needed.
Conclusion
The use of ECGI in the mapping of ventricular arrhythmia is a nascent field, with potential for use in SBRT and ablation of VF. The accuracy of the system’s capacity to reconstruct the ventricular activation sequence during sinus rhythm and pacing has varied across studies with methodological differences perhaps accounting for some of the variability. More recent data has suggested that when localising SoO for ventricular tachycardia (VT) it has reasonable accuracy and outperforms the 12-lead ECG. This accuracy is not currently sufficient to solely guide ablation although this could be improved with further research into the algorithms used to reconstruct the electrograms. Further work is also needed to understand the aetiology and impact of artefactual block lines that could hinder clinical application.
Positive clinical outcomes have been demonstrated in non-invasive radiation-based ablation of VT suggesting that the resolution it offers is sufficient when larger areas of myocardium are targeted, although lack of data prohibits any inferences regarding outcomes on guidance of RF ablation. If direct integration with contact mapping systems, where the calculated electrograms could be visualised on the contact mapping geometry, were feasible it could become a useful tool to expedite catheter ablation of VT. This latter point would be especially salient if further progress is made on the resolution of mapping.
Clinical Perspective
- Recent data from human studies comparing electrocardiographic imaging to electroanatomic mapping suggests the system has moderate accuracy in mapping cardiac activation times.
- This accuracy is sufficient to localise VT for defining large target areas for non-invasive ablation using stereotactic body radiation therapy with excellent outcomes in clinical trials.
- The capacity of the system to map activation times using a single beat may prove useful in haemodynamically non-tolerated VT, but resolution is insufficient to be the sole guide for ablation.